Sense & Scale

A site to explore cultures, cities, and computing at varying senses and scales. Updated by Ar Ducao, with content from classes at NYU, MIT, CUNY and more.

Contact: see syllabi

  • Announcements While you’re waiting for class to begin, please take a look at the links to prepare for class today. NYU Libraries: Upcoming tutorial classes on data visualization, analysis, and management software NYU Libraries Digital Humanities Flyer. Locative Media as Participatory Archives of Civic Engagement Agenda Check-ins Workshop Time Guest speaker:…

    Announcements

    While you’re waiting for class to begin, please take a look at the links to prepare for class today.

    Agenda

    • Check-ins
    • Workshop Time
    • Guest speaker: Marina Hassapopoulou, NYU Cinema Studies

    Next Week’s Assignments

    • First Visualization Project due October 4, next week!
      • Project Requirements are here.
      • A sample grade sheet is here.
      • Do you best for next week’s presentation. But if you aren’t satisfied with the outcome, I accept resubmissions (of all assignments). I will post resubmission policy next week.
      • Reminder: Your project posts DO NOT count toward the 9 weekly posts required for this semester. If you have questions about this, please let me know ASAP.
    + ,
  • Phase 1 Project, due October 4 Note: Keywords are highlighted in orange.  Develop a polished, accessible interactive visualization(s) of a pre-approved dataset for a general audience with no previous knowledge of the data. CHECKLIST: Dataset approved: You must receive approval to use the dataset by October 1 OR use a…

    Phase 1 Project, due October 4

    Note: Keywords are highlighted in orange. 

    Develop a polished, accessible interactive visualization(s) of a pre-approved dataset for a general audience with no previous knowledge of the data. CHECKLIST:

    • Dataset approved: You must receive approval to use the dataset by October 1 OR use a dataset from the class’s pre-approved list.
    • Accessible: Anyone (namely, your instructor) must be able to interact with your visualization outside of class. Please provide a link from your blog. No screenshots!
      • If the visualization uses HTML/Javascript, please post it either on a standalone web page or on a code playground like JSFiddle or Codepen. Embed the visualization in your blog or include the link in a blog post.
      • If your visualization is hosted by a cloud site (ie ArcGIS cloud), make sure that you modify permissions so that the public can view it.
      • If the visualization is not online, please send me the files, application links, and/or materials I need to interact with the visualization offsite. Please do this by October 3 at 11am.
      • If the visualization is physical (i.e. uses physical computing), e-mail me.
    • Polished: include keys, colors, annotations, and other relevant information to show and explain patterns in the data that can only be understood through your project.
    • Explainable: include introductory text and titles so that a general user has all the information she/he needs to engage with and understand the visualization without further explanation.
    • Presentable: Be prepared to talk the class through a 4-5 minute demonstration of your visualization, followed by 3-4 minutes of Q&A. Please remember to link to all materials from your blog.
    + ,
  • Announcements While you’re waiting for class to begin, please take a look at the links to prepare for class today. MIT CREATE Mozilla Hive NYC CSforAll Agenda Guest Speaker: Kate Mytty of MIT CREATE. Some examples that might be relevant: https://www.openprocessing.org/sketch/462297 https://bl.ocks.org/mbostock/4062045 Guest Speaker: Rafi Santo of NYU and CSforAll. Vis…

    Announcements

    While you’re waiting for class to begin, please take a look at the links to prepare for class today.

    Agenda

    Next Week’s Assignments

    • Discuss datasets you’re thinking about. Write a brief post about some of the datasets you’re considering, either from the “Approved” Datasets, from the community partners, or from your own exploration. What are some of your considerations for choosing your Phase 1 dataset?
    • Discuss your visualization progress. Please show screenshots and updates on your visualization progress. We will spend some time next week on your work, questions, and progress.
    • Please pick a paper-based visualization from last week (from the MIT CREATE session) that interests you, and explain why.
    + ,
  • Announcements While you’re waiting for class to begin, please take a look at the links to prepare for class today. http://www.urbanmakereconomy.org/ http://www.bostonhousing.org/ 2018 Community Partners and Student Blogs now posted (see class menu) Agenda Guest Speaker: Laura Wolf-Powers on Urban Makers. Guest Speaker: Jonathan Tarleton from Boston Housing Authority. A Brief…

    Announcements

    While you’re waiting for class to begin, please take a look at the links to prepare for class today.

    Agenda

    • Guest Speaker: Laura Wolf-Powers on Urban Makers.
    • Guest Speaker: Jonathan Tarleton from Boston Housing Authority.
    • A Brief History of Data Vis and Toolkit
    • Discussion of last week’s exercise and assignments

    Next Week’s Assignments

    • Start Visualizing. Use the toolkit you’re building to start visualizing data to show on September 20.
      • Please post screenshots or a link to your blog, as well as a discussion of your progress.
      • Please use one of the class’s pre-approved datasets or e-mail me to get approval for another data set of your choice.
      • You can use this assignment to start working towards your first full visualization, which will be due on October 4. (You can see last year’s Phase 1 Project Grading Criteria here, which will be similar to this year’s criteria. Some of the visualization tutorials need to be updated.)

    Photos From Last Week’s Physical Vis Exercise


    + ,
  • in alphabetical order by last name Simin Gu Chian Huang Yan Huang Richelle Newby Emilie Shen Yuanyuan (Nicole) Song Jingyuan (Evelyn) Xu Steven (Dong Woo) Yoo Zhenwen (Wayne) Zhang  

    + ,
  • Confirmed Partners Accountability Project (contact: Ryan Schlief) Data: https://ewsdata.rightsindevelopment.org/login/?next=/projects/ Since we have a mix of data, including community generated and scraped ‘public’ data, the project could involve 1) pulling together our community generated data (via survey monkey) in 5 countries to discover commonalities and differences in how communities experience development projects. (Ex…

    Confirmed Partners

    • Accountability Project (contact: Ryan Schlief)
      Data: https://ewsdata.rightsindevelopment.org/login/?next=/projects/
      Since we have a mix of data, including community generated and scraped ‘public’ data, the project could involve 1) pulling together our community generated data (via survey monkey) in 5 countries to discover commonalities and differences in how communities experience development projects. (Ex https://accountabilityproject.org/wp-content/uploads/2017/09/IAP_8steps_infographic.pdf) For the scraped ‘public’ data we are interested 2) to better answer particular questions about the trends in development by geography, sector and development bank. We could build on existing data visualizations if helpful. (Ex: https://rightsindevelopment.org/project/the-inter-american-investment-corporation/). As you can see, we have in house experience of data visualization – but we are quite novice. There are openings for more creative, involved visualizations.
    • BrainPop (contact: Kevin Miklasz)
      Data: https://research.donorschoose.org/t/download-opendata/33 
      This crowdfunding website connects teachers to donors to find funding for classroom supplies. There are two interesting parts of the data set to me- the project success and the project descriptions. I’d be interested in two general questions- first, does this data show any pattern in what kind of projects are most successful over time, and any variation in those patterns over time? (which edtech projects from which companies, digital vs. physical, which pricepoints, which kind of descriptions?) Second, what about the freeform text description has made certain projects more successful than others? (certain keywords, description length, time of year, etc.) This dataset is one of the few publicly available datasets that allow comparison of different EdTech products success, and at that from a teacher’s perspective.
    • Boston Housing Authority (Contact: Jonathan Tarleton)
      Data is here (available to class members only). 
      Boston Housing Authority administers 13,000+ housing choice vouchers, which provide a subsidy for low-income families to rent on the private market. We have addresses for our voucher holders quarterly over time dating back to 2007. We’d like to visualize this information to show the movement of voucher holders around the Boston Region in relation to housing market changes.
    • CSforAll (Contact: Leigh Ann DeLyser)
      Data: Some of it is visible at http://www.csforall.org/members
      CSforALL is a nation 501c3 focused on bringing computer science education to all schools in the US. We would use this project not only to show our data, but also as an example of what data science is for teachers to share with students. CSforALL has two related data sets we would like to see visualized. First, our membership database (http://www.csforall.org/members). Our member list contains additional information about each member (beyond what is visible on the web) and we would like a better way to represent the members in a visualization (other than just a list). Similarly, we run a national summit every year (http://summit.csforall.org), and this year have collected over 200 commitments from over 250 organizations. The commitment database also could use an interesting visualization.
    • Locative Media as Participatory Archives of Civic Engagement  (Contact: Marina Hassapopoulou)
      Data is here
      This project is an EDIT (Equity Diversity & Inclusion in Teaching Media) featured teaching project. The multimedia nature of the submitted/archived data makes this a challenging project to visualize interactively. Read more here.
    • MIT CREATE (Contact: Kate Mytty)
      Data (a day in the life of a street vendor in Durban): contact Kate Mytty. MIT CREATE is a team of researchers and practitioners working to imagine the future of urban exchange by: understanding how these ‘productive urban spaces’ contribute to the overall urban economy; developing new the methodologies and related tools that can be used to capture complexities of informal spatial practices tied to urban exchange; and gathering data to build urban intelligence, and work with communities to develop real, collaborative design and policy solutions.

    Unconfirmed Partners

    • PeaceTech Lab (Contact: Althea Middleton-Detzner)
      Data: http://www.peacetechlab.org/lexicons/
      PeaceTech Lab has developed a lexicon of online hate speech for South Sudan, Nigeria, and Kenya and are looking for new ways to represent the hate speech data for these lexicons, as well as our ongoing social media monitoring reports, in which we connect online hate speech with offline violence in these contexts. Since we are applying media, tech, and data to peacebuilding programs, we often find ourselves with an immense amount of data that we would like to visualize and represent to our wide audience(s), but could use some support in doing so.
    • Kawsay (contact: Mario Gampieri)
      Kawsay is a for-profit social enterprise working to provide relevant information and analysis to organizations working to provide basic services to underserved populations. Currently we are working with a range of organizations in Lima, Peru, where millions of people live in informal communities in the periphery of the city.
    • Loisaida Seedbed (Contact: Alejandro Epifanio)
      Data (equipment inventory and understanding potential usage): Contact Alejandro Epifanio.
      Loisaida began as a grassroots movement in the Lower East Side (LES) led by Puerto Rican activists and Hispanic residents in the mid 1970’s. More on the data: We would like to visualize how a list of various equipment sorted out into different rooms can help us organize a potential time and use limit per specific room and equipment during facility operational hours. Basically we have close to 70-100 digital and analog technology items that have to be assigned into designated rooms to create a visual inventory of time available per each item.
    • HLW (Contact: Peter Bacevice)
      Data: NYC-Local Law 84 and NYC OASIS database from DOITT.
      HLW is a full service architecture, interiors, strategy, lighting, planning, and sustainability firm.


    + ,
  • Announcements While you’re waiting for class to begin, please take a look at the links as food for thought. Example Vis: Transit Visualization Client, Conversation Concept Map, MIT ML Pantheon Example Data Source: Socioeconomic Data and Applications Center (SEDAC), NYC Open Data Example application of data visualization: The Next America, The Search for High Energy…

    Announcements

    While you’re waiting for class to begin, please take a look at the links as food for thought.

    Agenda

    Next Week’s Assignments

    • BLOG: If you don’t have a blog already, set one up. Email me the blog URL by Thursday, Sept. 13 at 11 AM.
    • POST: Introduce yourself and your interests/goals for this class. Please also explain your thoughts for the potential toolkit (aka tech stack) that you’d like to use for this class. Phase 1 will be about exploring and solidifying your toolkit. See the assignment slideshow for “buffet” ideas. Your toolkit explanation should include:
      • names of your potential tools
      • justification of your choice
      • tool history and sociology
      • use cases and examples
      • constraints / challenges
      • discuss your tutorial process (see below)
    • TUTORIAL: Go through at least 1 tutorial for your tool(s). Discuss this in your first blog post (see above). Feel free to contact me if you need help selecting a tutorial.
    + ,
  • Data Visualization For The Community [Formerly Data Visualization from 2D to 4D] DM-GY 9103-C, Fall 2018 Prof. Arlene Ducao, arlduc [at] nyu.edu Thursdays, 3:30-6:20 PM 2 Metrotech, Room 820 Overview What is data visualization? Why and how do we do it? Who do we do it for? This course will…

    Data Visualization For The Community
    [Formerly Data Visualization from 2D to 4D]

    DM-GY 9103-C, Fall 2018
    Prof. Arlene Ducao, arlduc [at] nyu.edu
    Thursdays, 3:30-6:20 PM
    2 Metrotech, Room 820


    Overview

    What is data visualization? Why and how do we do it? Who do we do it for? This course will take you through the process of understanding data visualization role’s in our information landscape, evaluating the kind of data that is best for visualization, and connecting with communities that provide and use the data. Prerequisites: a basic understanding of HTML, CSS, and one scripting language, i.e. Javascript.

    Learning Goals

    • To understand the history, functionality, and anatomy of data visualization.
    • To classify data and information visualization based on temporal, spatial, tangible, and contextual criteria.
    • To understand the politics and community contexts that inform data visualization.
    • To choose and apply the appropriate tools for developing a wide array of basic data visualizations.
    • To plan and execute a complex data visualization project based on human-centered design principles, including significance, relevance, and usability.

    Schedule

    Note: Guest lecturers and trips are subject to change.

    Phase I: Let’s Visualize.
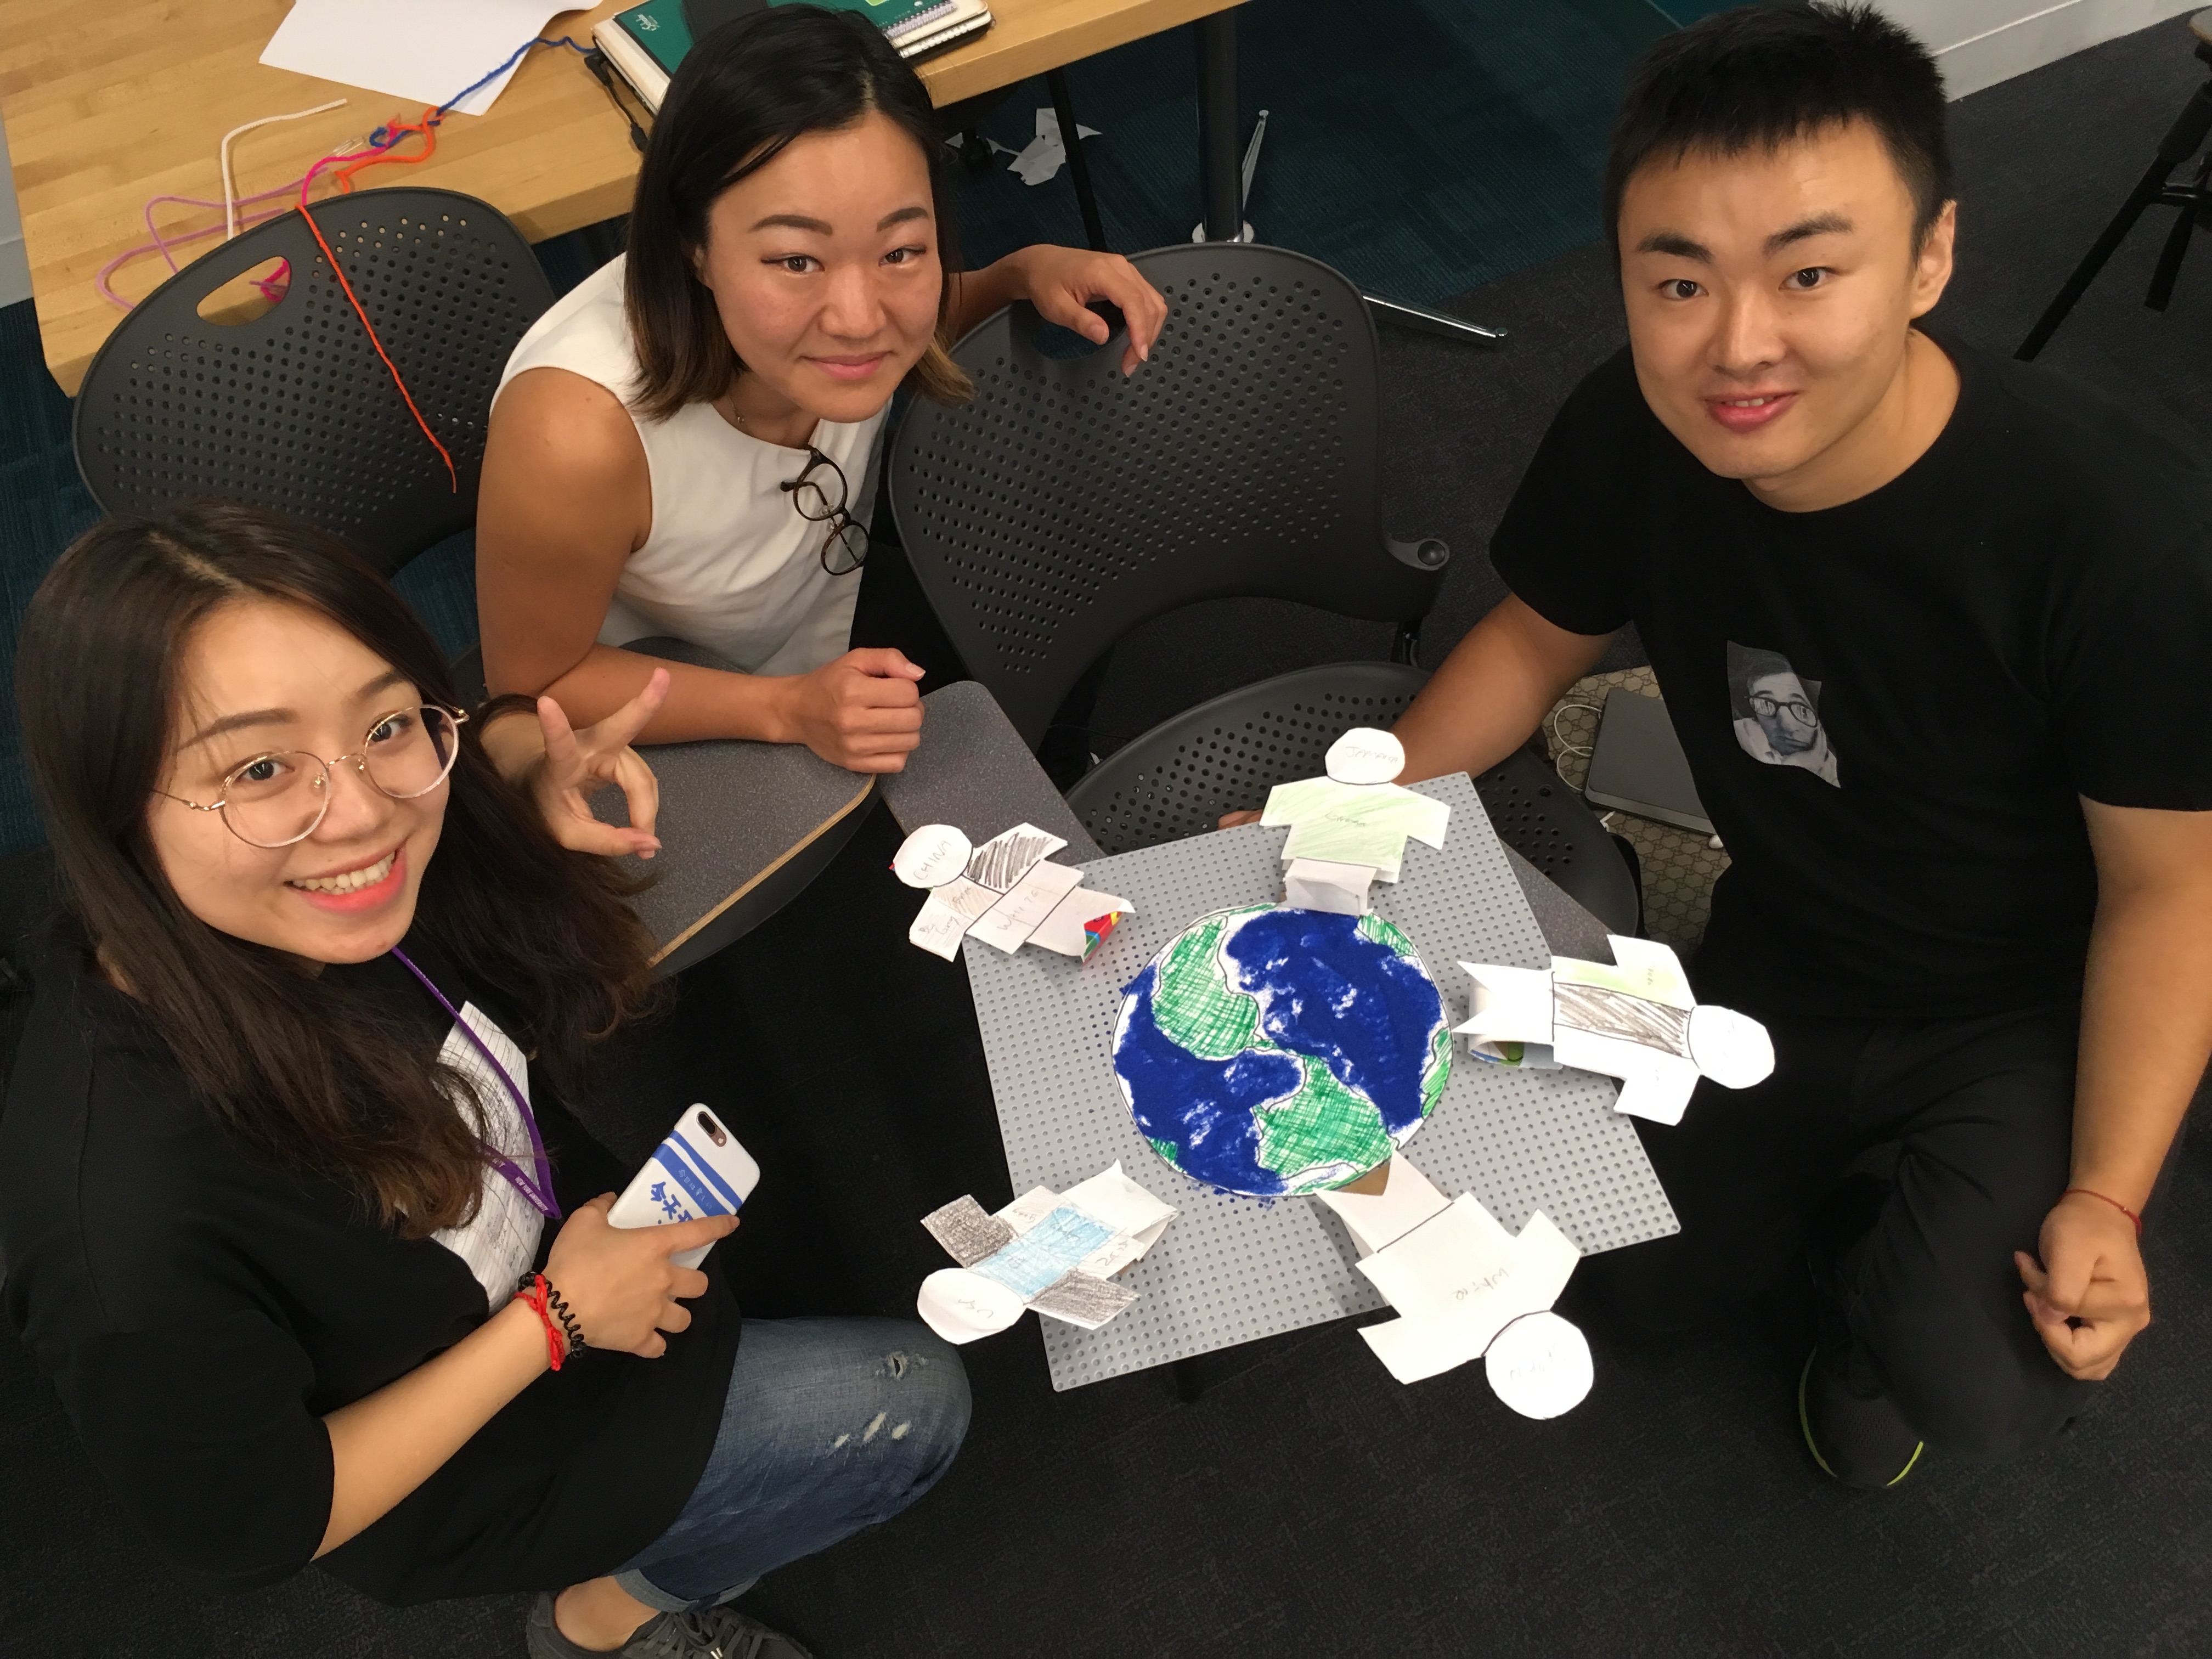
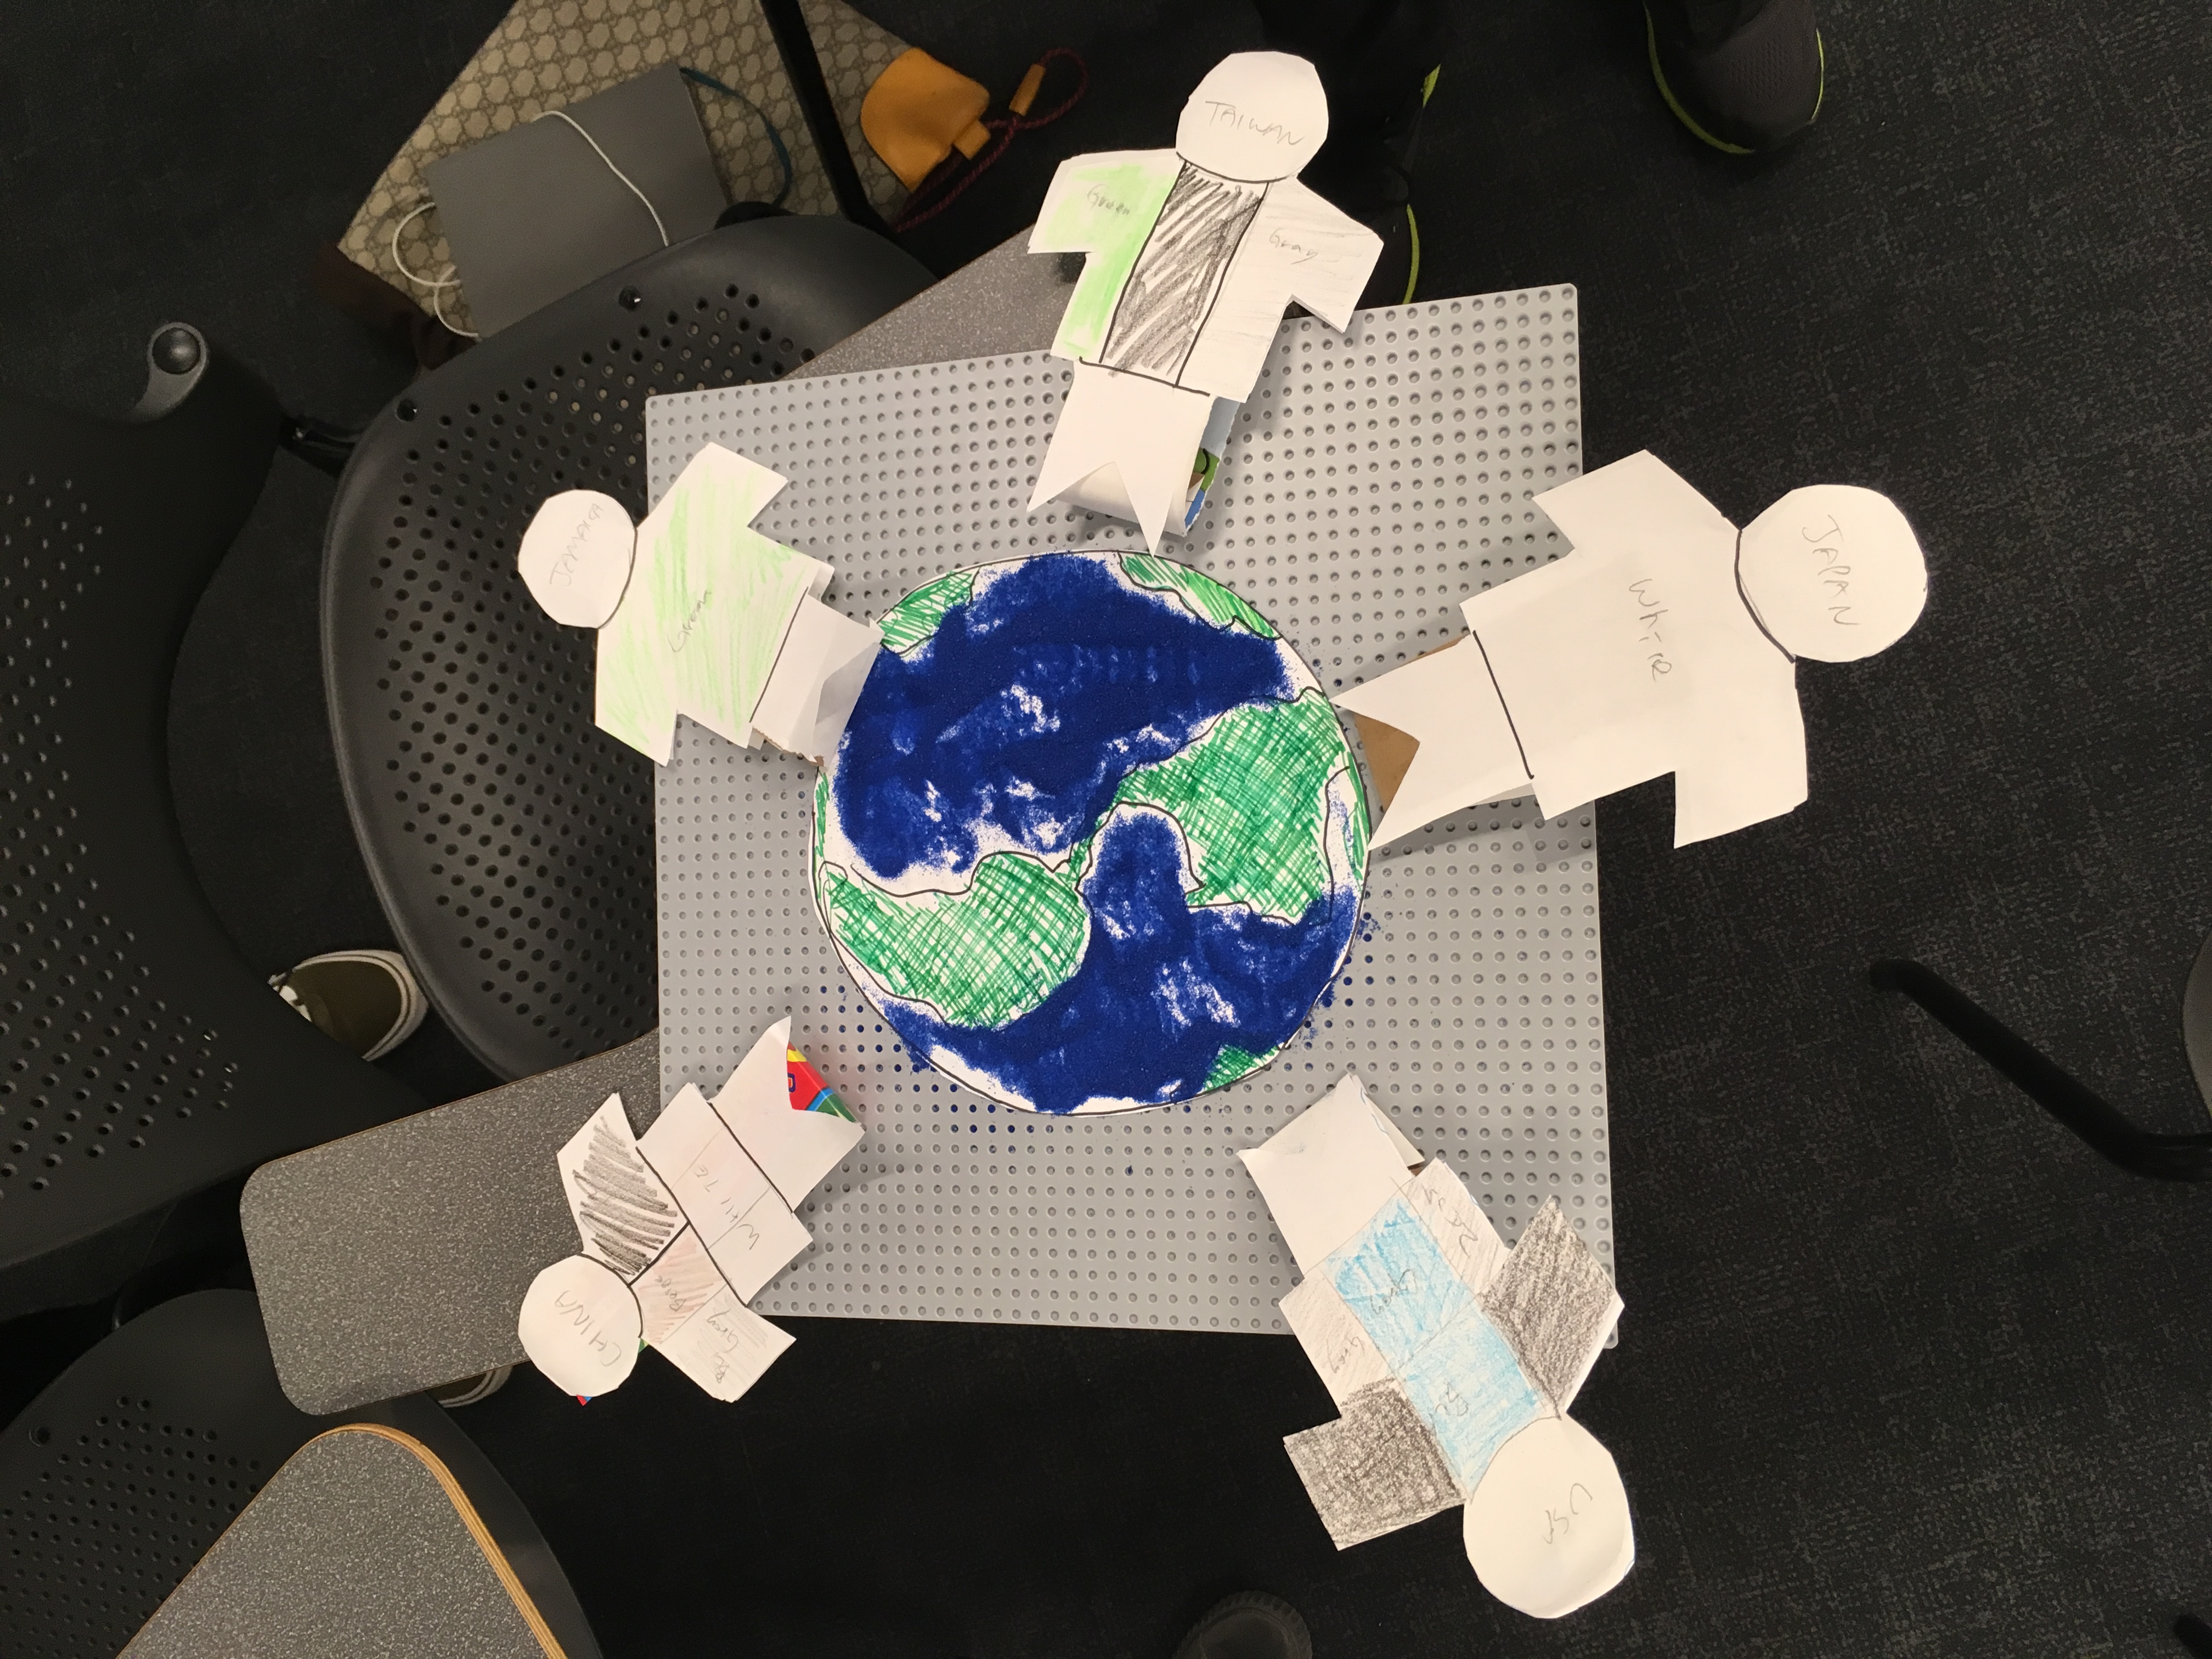
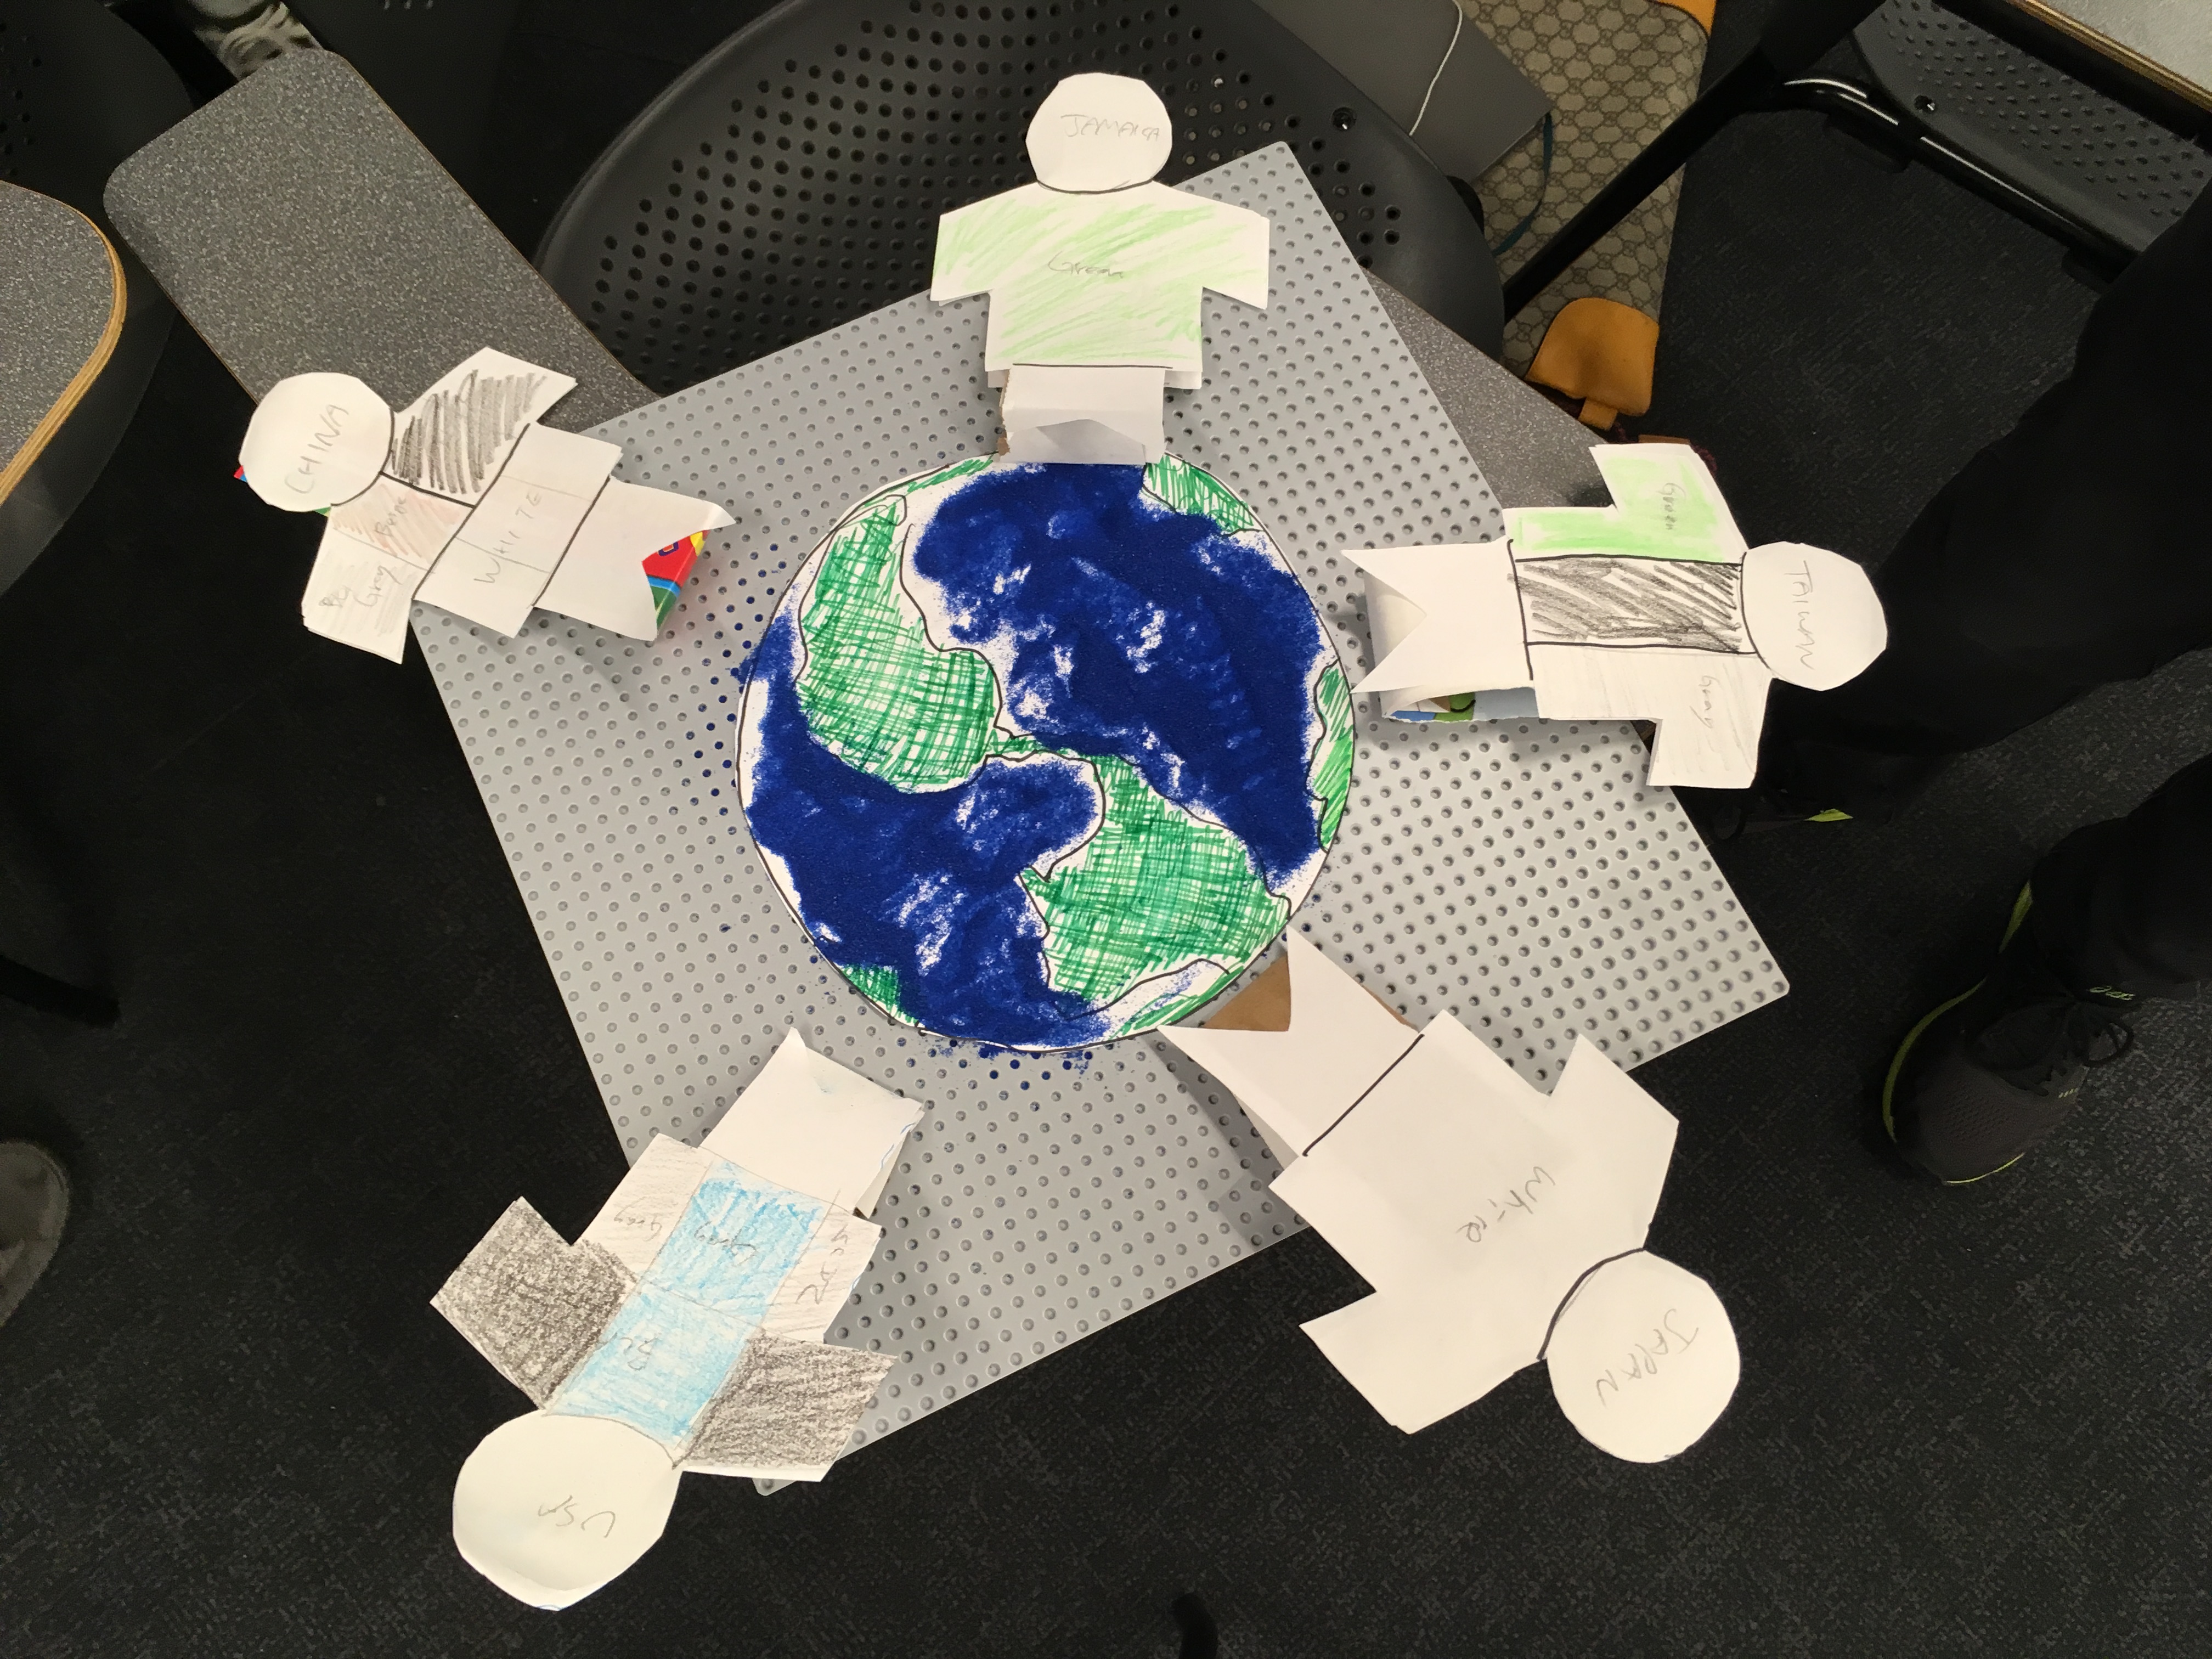
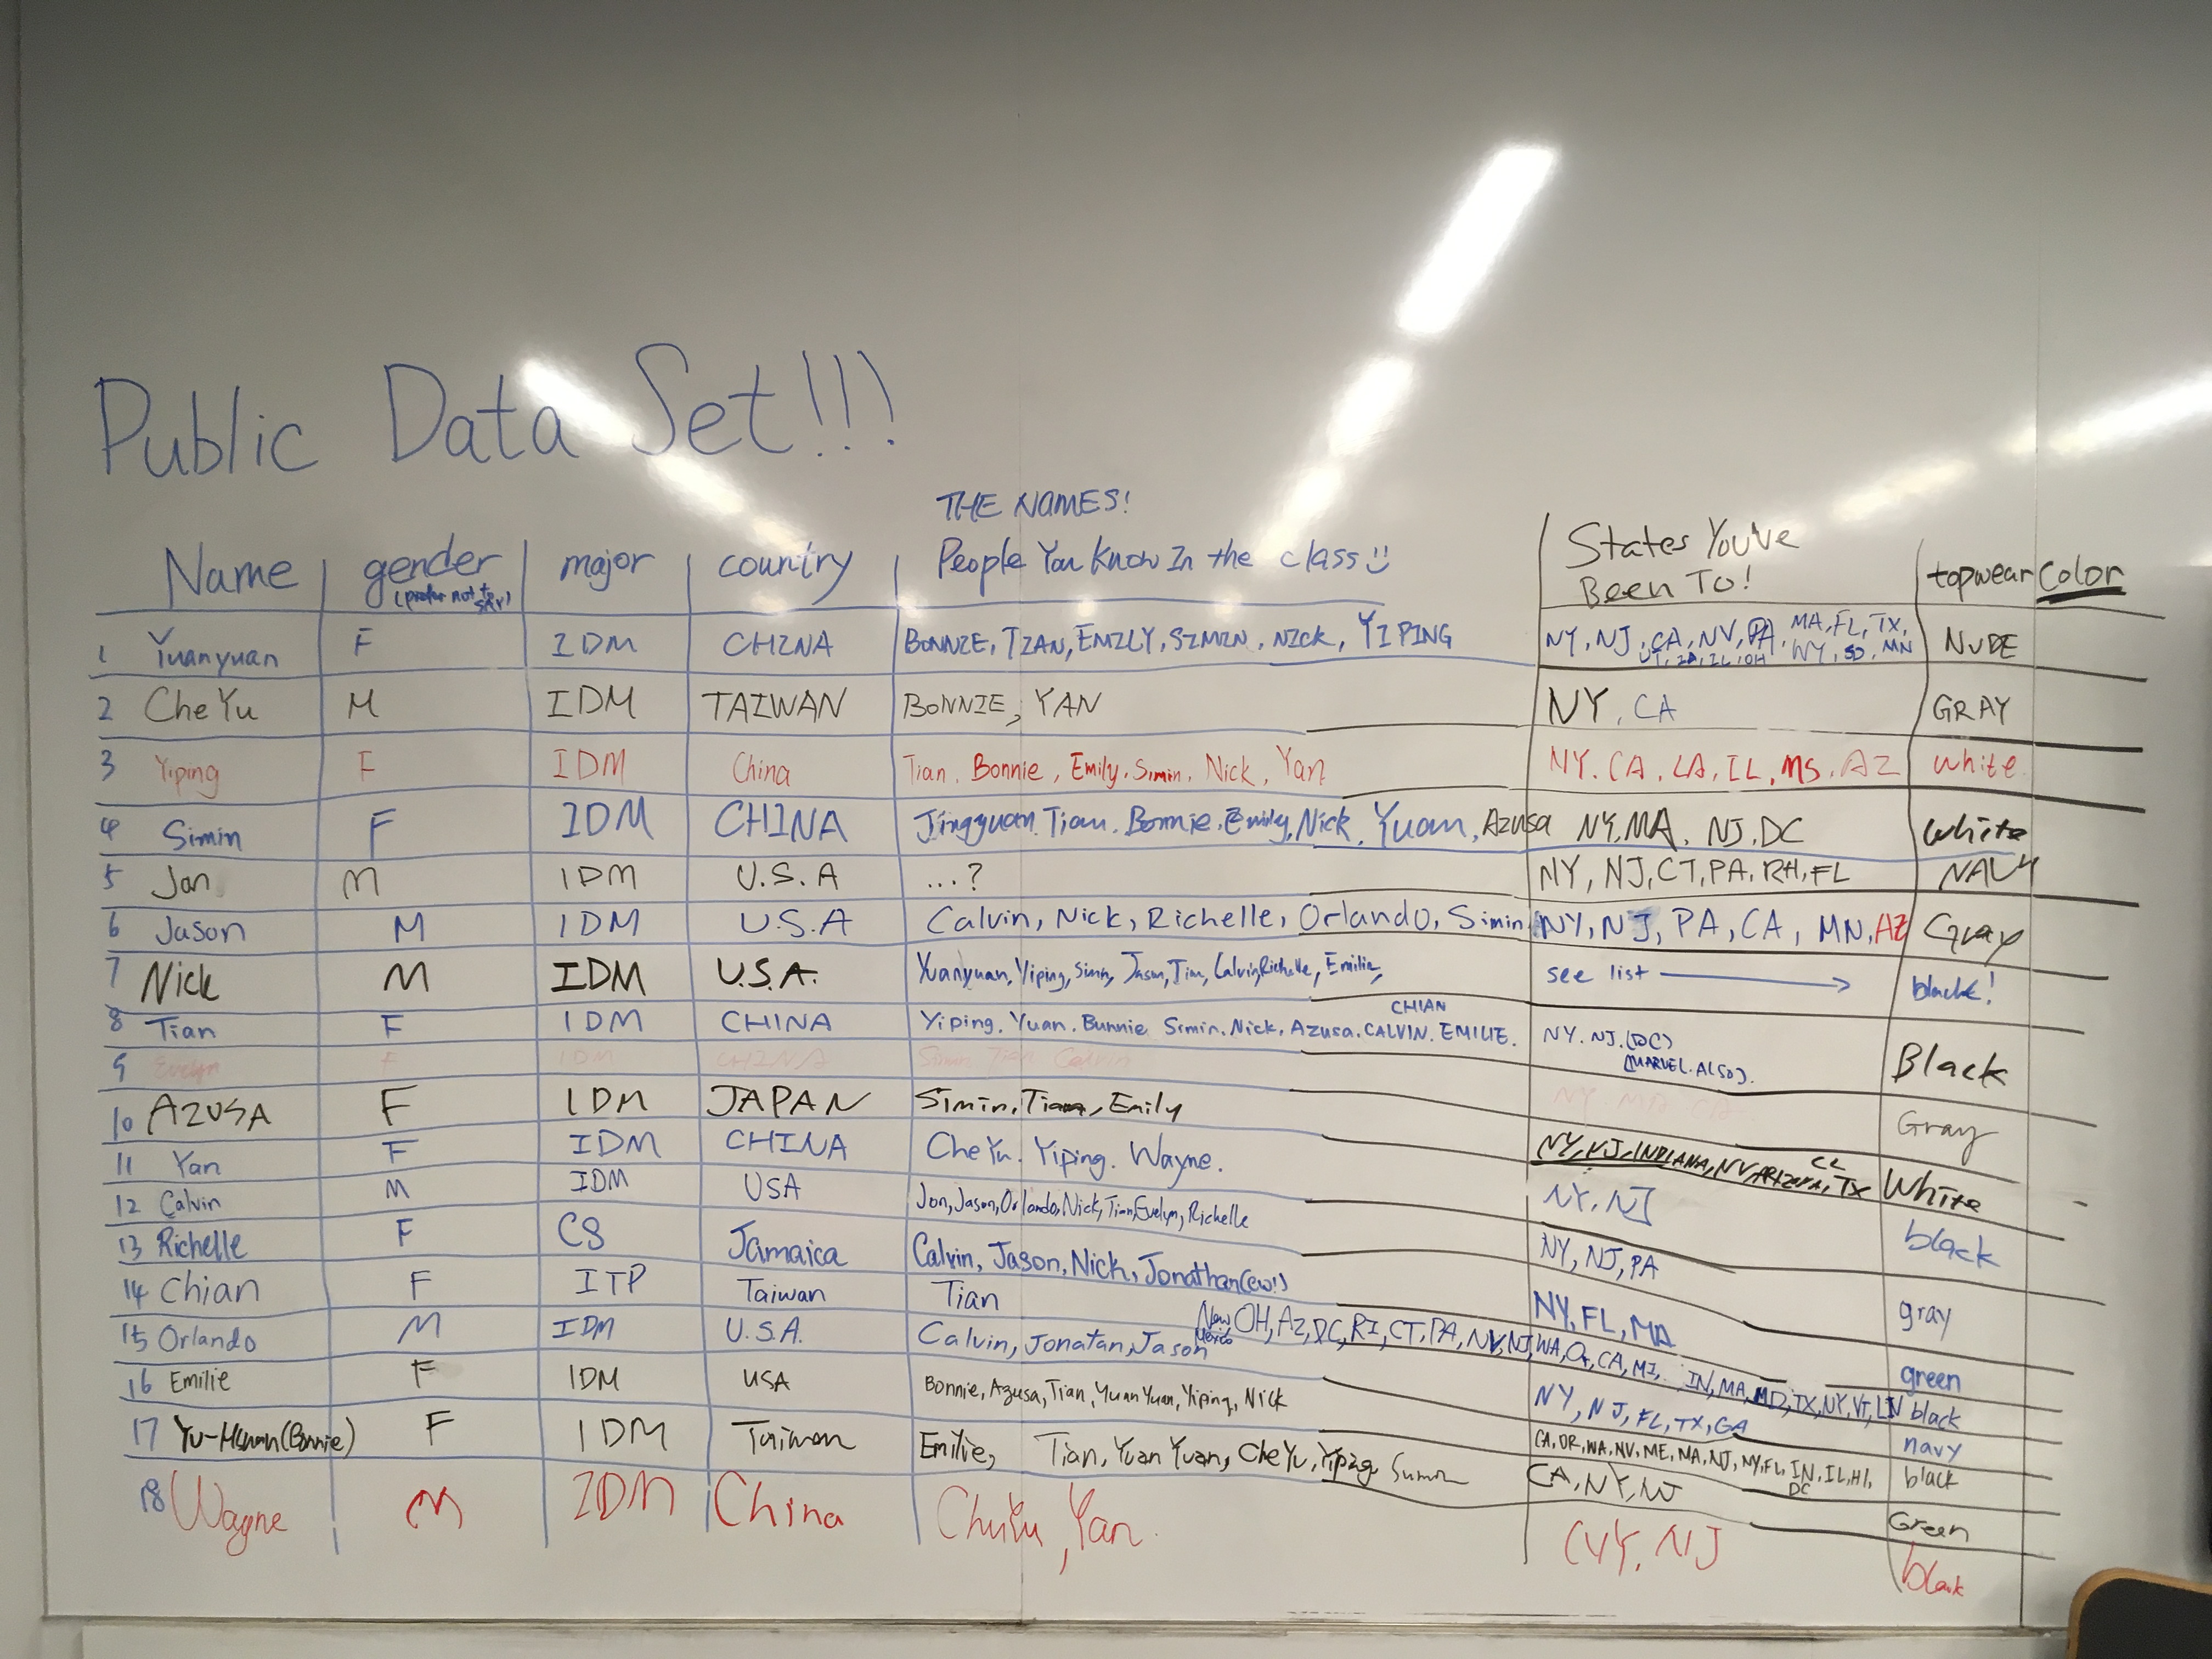
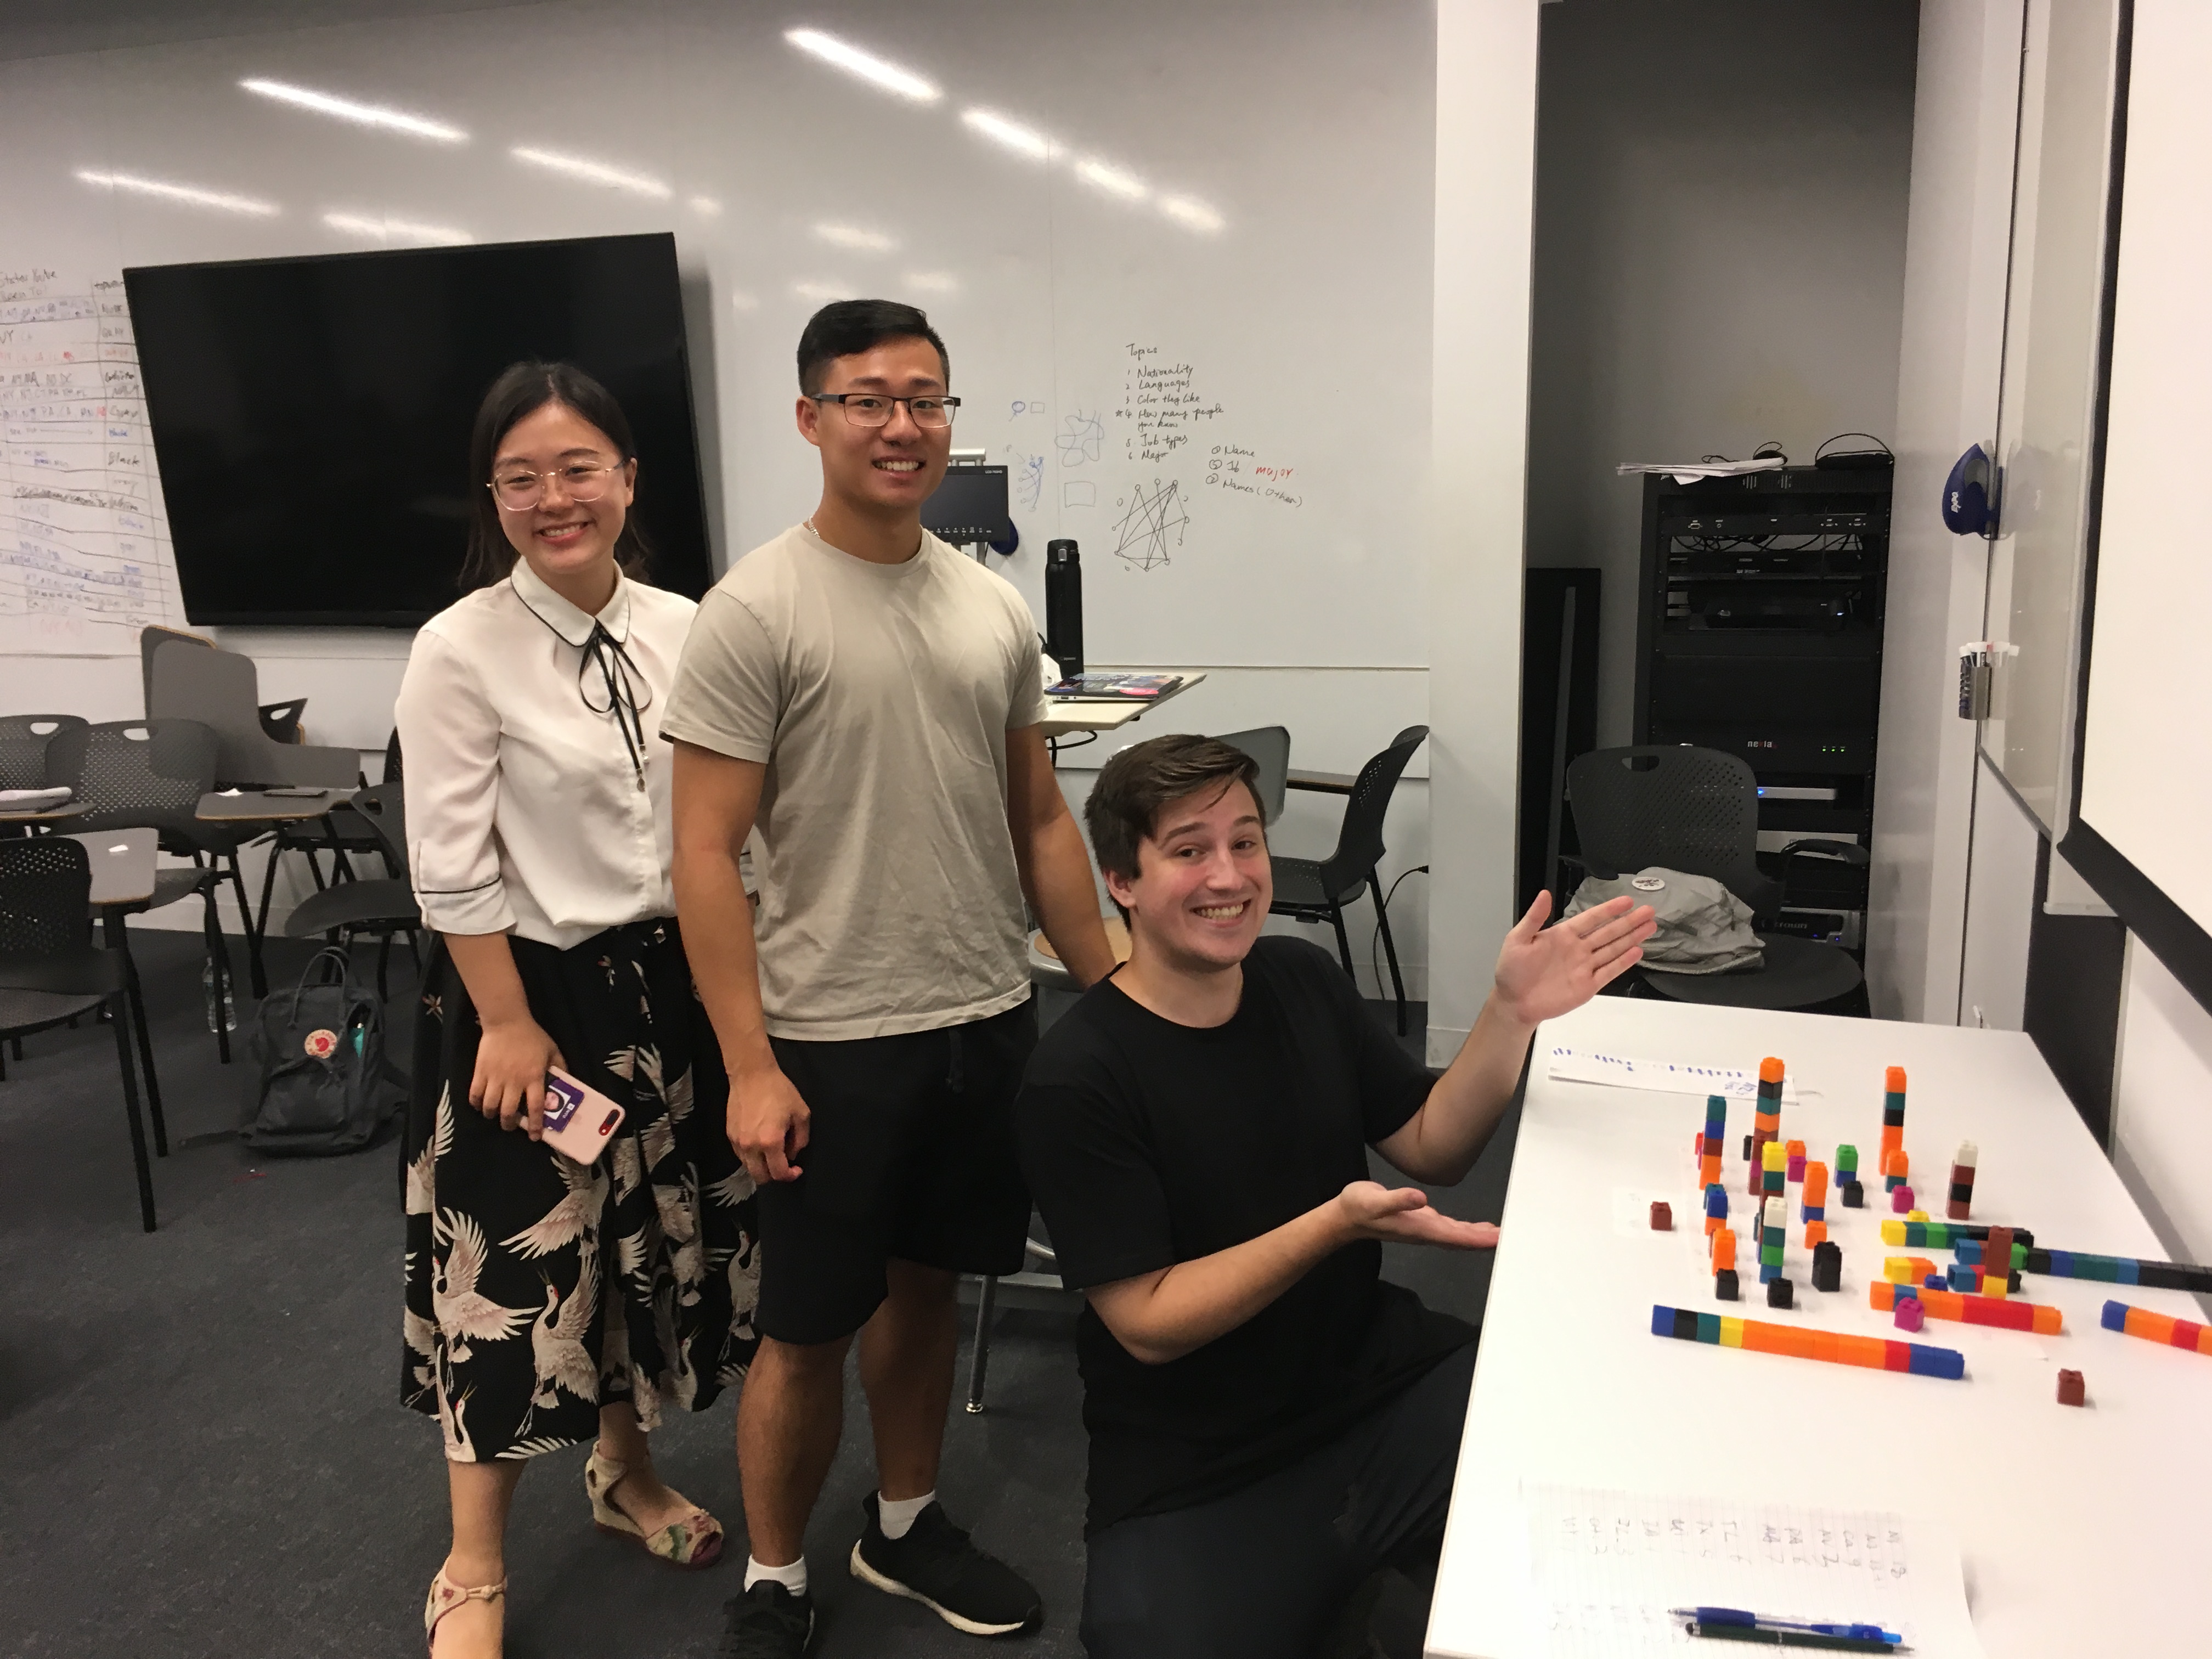
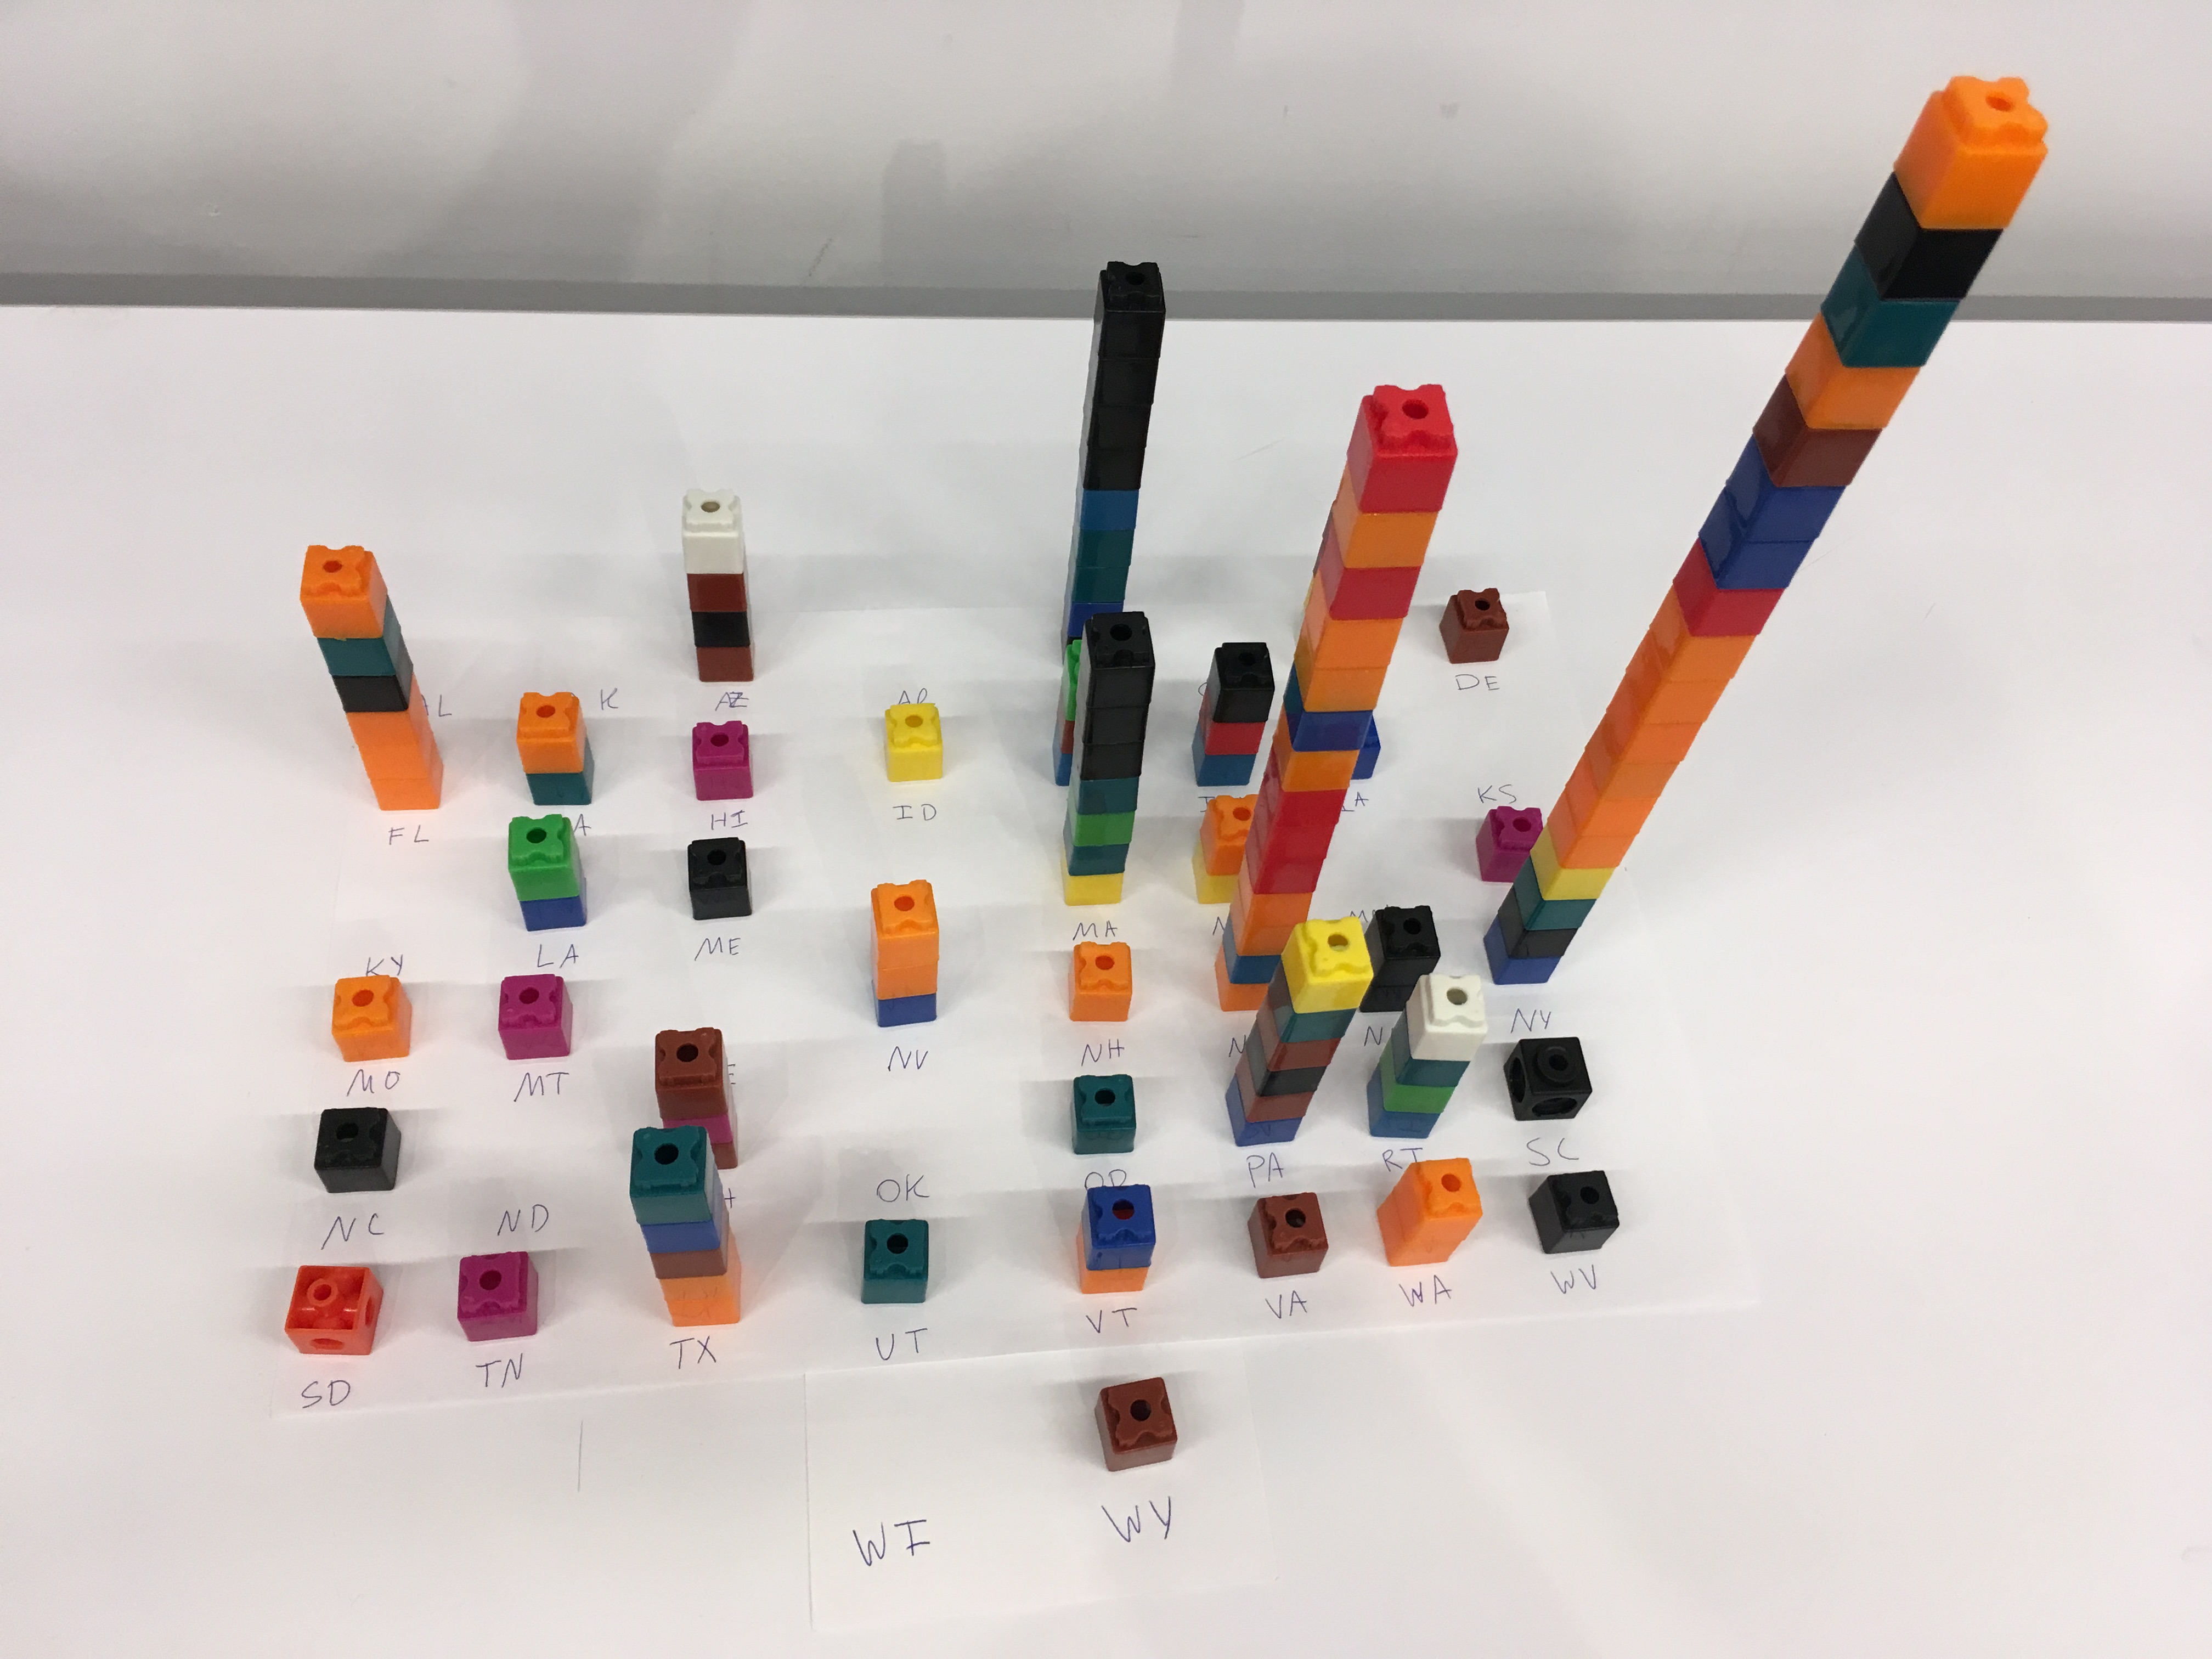
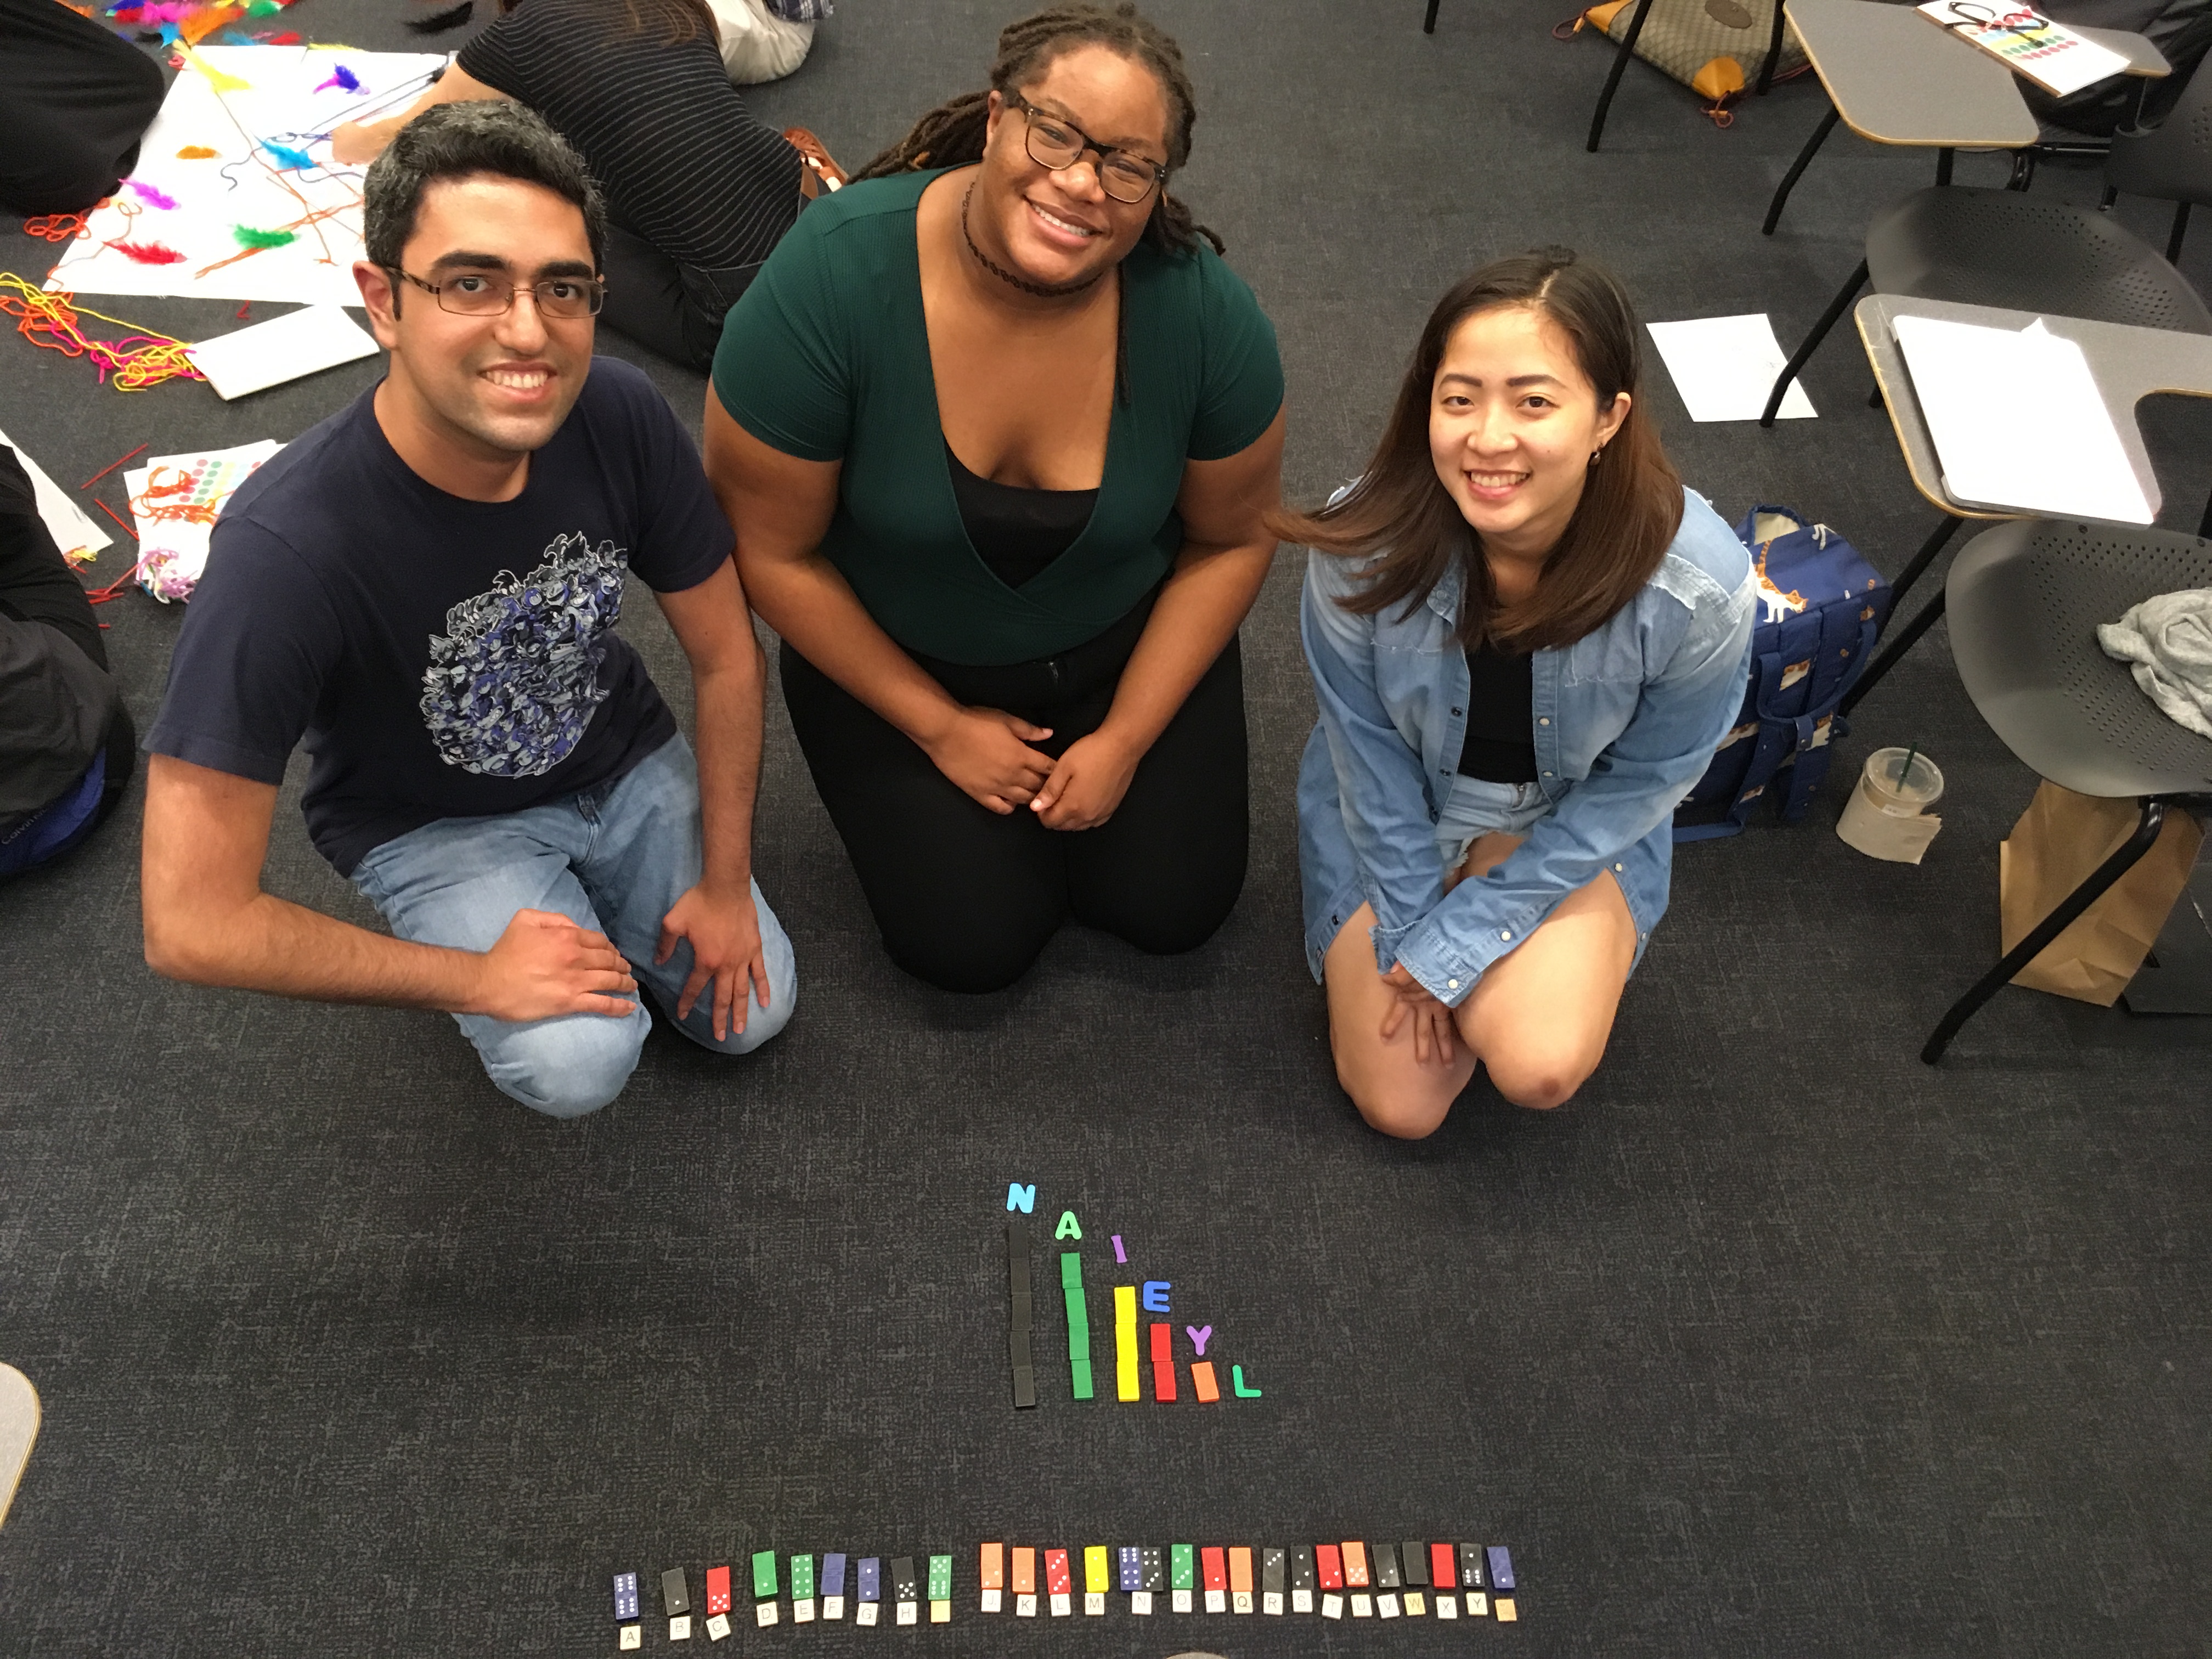
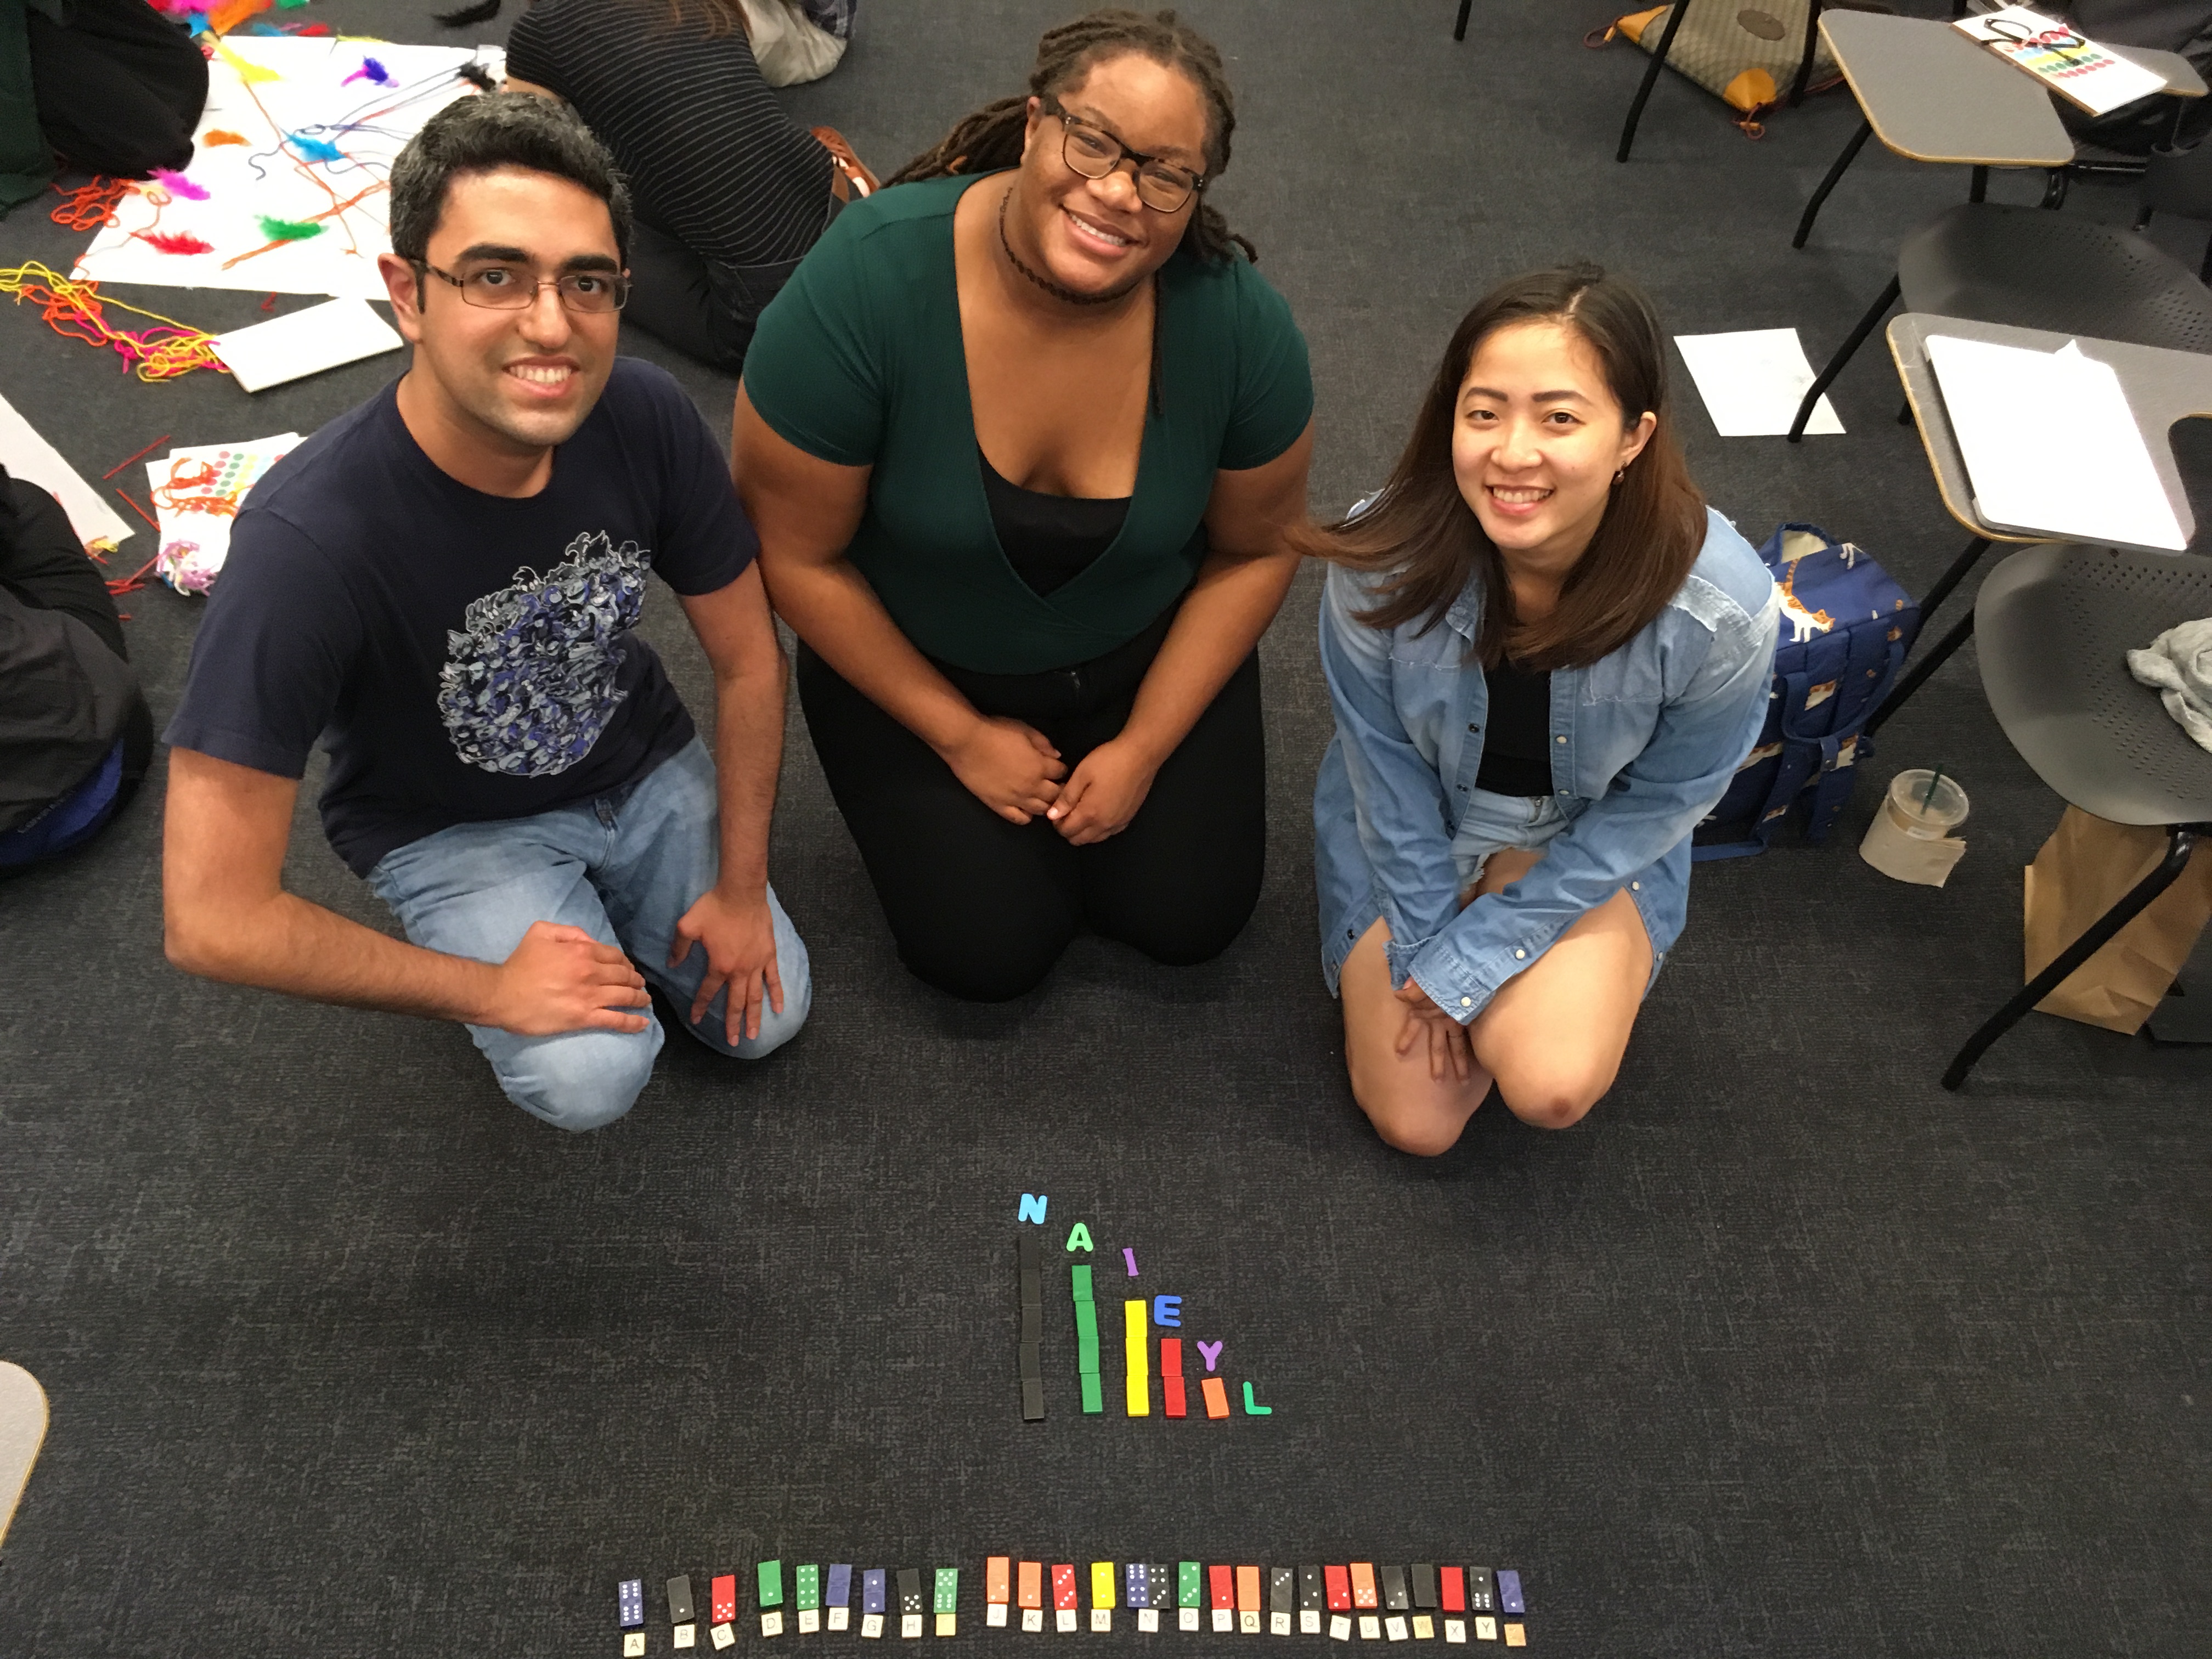
    • Session 1: September 6. Class Overview, Icebreaker, and Toolkit.
    • Session 2: September 13. Urban Data. Guests: Prof Laura Wolf-Powers, Hunter College Urban Policy and Planning; Jonathan Tarleton, Boston Housing Authority.
    • Session 3: September 20. Context, Education, and Informal Economies. Guests: Kate Mytty, MIT CREATE; Raphael Santo, NYU/CSforAll
    • Session 4: September 27. Image-based Data. Guest : Marina Hassapopoulou, NYU Moving Image Archiving and Preservation.
    • Session 5: October 4. Phase 1 visualization presentations.
    Phase 2: Whose Data Is It, Anyway?
    • NO CLASS: October 11. Self-guided field trip to NYSCI.
    • Session 6: October 18. Field trip to Pro-Public and NYU Data Services (Bobst).
    • Session 7: October 25. Book Club and Beyond Visualization: Data Analysis. Guest TBD.
    • Session 8: November 1. Book and community updates. Guest TBD.
    • Session 9: November 8. Phase 2 paper presentations.
    Phase 3: Visualization for Actual People.
    • Session 10: November 15. Guest Speaker: Nick Bartzokas, American Museum of Natural History. Phase 3 check-ins. Activism Collaborative Storymap.
    • NO CLASS: November 22, Thanksgiving.
    • Session 11: November 29. Data Vis Distinguished Alum: Anneka Goss. Phase 3 one-on-one project discussions. Color Discussion. Good Vis, Bad Vis.
    • Session 12: December 6. Student Requests (guests and discussions). Final Project Studio time.
    • Session 13: December 13. Final project presentations. Invite your community partners!

    Suggested Tools (and see more in the Assignment 1 PDF)

    • Data exploration tools. See some examples at Northwestern Knight Lab and DataBasic.io.
    • A tabular software environment (e.g. Excel, Google sheet, Zoho sheet, etc.)
    • A relational software environment or interface (e.g. MySQL, Tableau, SODA)
    • Web visualization libraries (e.g. D3.js, Threejs, Bokeh, SVG)
    • A cartographic package (TileMill, CartoDB, QGIS)
    • A natural language processing tool (IBM Watson)
    • A 3D or CAD tool (e.g. Unity3D, TinkerCAD)
    • Creative computing tools (e.g. Processing, Arduino, Quartz Composer)
    • Data Analysis tools (e.g. R, Jupyter Notebooks, Matlab, SPSS)

    Recommended Books (to be discussed in Class 1)

    Technique / Science Books

    Historical / Foundational Books

    Recommended Web Sites

    • http://visualizingrights.org/kit/

    Office Hours

    Thursday by appointment. E-mail arlduc [at] nyu.edu to make an appointment.

    Grading

    • 20% Phase 1 Project: Demonstration of prototype & brief write-up.
    • 20% Phase 2 Paper: Research article & MLA-formatted bibliography.
    • 25% Phase 3 Final: An ethnographic project drawing on skills and concepts developed in Phase 1 and 2.
    • 20% Class participation, engagement, respect.
    • 15% Weekly blog posts based on class discussion and project development. At least nine posts are required for the semester (three posts per class phase). These posts should be numbered (e.g. “Blog Post #1”). Blog posts of the Phase 1, 2, and 3 projects do not count towards the nine required weekly posts.
    • Encouraged extra credit options:
      • Expanded blogging
      • Video documentation
      • Project web site
      • Conference paper

    Attendance

    Attendance to all class sessions is mandatory. Class starts at 3:30 sharp. Excused absence requests, i.e. for a religious holiday or a conference, must be made at least 3 business days ahead of the scheduled absence. Emergency absences must be accompanied by official documentation, i.e. a doctor’s note or MTA notice. One letter grade drop will occur for every two unexcused late arrivals or one unexcused absence. For additional NYU School of Engineering Academic Policies and Requirements, please consult this link.

    Technology Use in the Classroom: Participation, Engagement, Respect!

    Laptop computers and other mobile devices are invaluable tools when used responsibly. However, this technology can also be incredibly distracting, especially in the classroom. When in class, you may use your laptops and other devices for any activities pertaining to the course: taking notes, researching material relevant to our readings and discussions, doing VFS homework, making class presentations, etc. However, if I sense that technology use is occurring at the expense of participation, engagement, and respect, I will require that all laptops and phones be stowed away. Also, during class screenings and class presentations, your laptops should not be used.

    Academic Honesty

    All work for this class must be your own and specific to this semester. Any work recycled from other classes or from another, non-original source will be rejected with serious implications for the student. Plagiarism, knowingly representing the words or ideas of another as one’s own work in any academic exercise, is absolutely unacceptable. Any student who commits plagiarism must re-do the assignment for a grade no higher than a D. In fact, a D is the highest possible course grade for any student who commits plagiarism. Please use the MLA style for citing and documenting source material.

    Moses Statement

    If you are student with a disability who is requesting accommodations, please contact New York University’s Moses Center for Students with Disabilities at 212-998-4980 or mosescsd@nyu.edu.  You must be registered with CSD to receive accommodations.  Information about the Moses Center can be found at www.nyu.edu/csd. The Moses Center is located at 726 Broadway on the 2nd floor.
    + ,
  • Announcements Reminder of Final Presentation Requirements: Your presence in class. 10 minutes of presentation. Start with your final object and story (~5 min) Walk us through the ideation, iteration, and prototyping process of the past several weeks (~5 min) A slideshow (e.g. powerpoint, keynote, google slides) is recommended. 5 minutes…

    Announcements

    • Reminder of Final Presentation Requirements:
      • Your presence in class.
      • 10 minutes of presentation.
        • Start with your final object and story (~5 min)
        • Walk us through the ideation, iteration, and prototyping process of the past several weeks (~5 min)
        • A slideshow (e.g. powerpoint, keynote, google slides) is recommended.
      • 5 minutes discussion with guest critics and class.
    • Extra credit (10 points added to your final project grade): Attend a training at any of NYU’s Makerspaces and document it with
      • 3+ photos and
      • 2+ paragraphs.
        Be sure to take a photo and record the name of the training instructor for this assignment to be counted.

    Agenda

    Assignments

    • Get those final requirements in by this Sunday, May 6 at 10AM! Have a great late spring and summer!
    + ,
  • Announcements Final Presentation Requirements: Your presence in class. 10 minutes of presentation. Start with your final object and story (~5 min) Walk us through the ideation, iteration, and prototyping process of the past several weeks (~5 min) A slideshow (e.g. powerpoint, keynote, google slides) is recommended. 5 minutes discussion with…

    Announcements

    • Final Presentation Requirements:
      • Your presence in class.
      • 10 minutes of presentation.
        • Start with your final object and story (~5 min)
        • Walk us through the ideation, iteration, and prototyping process of the past several weeks (~5 min)
        • A slideshow (e.g. powerpoint, keynote, google slides) is recommended.
      • 5 minutes discussion with guest critics and class.
      • I’ll publish the order of presentations next Thursday.
    • Extra credit (10 points added to your final project grade): Attend a training at any of NYU’s Makerspaces and document it with
      • 3+ photos and
      • 2+ paragraphs.
        Be sure to take a photo and record the name of the training instructor for this assignment to be counted.
    • Box Designers:

    Agenda

    Assignments

    • FINISH your final project.
    • BRING your final project to class.
    + ,