While it’s not generally feasible to learn how to build an iOS app from scratch in one three-hour session, the aim of this crash course is to help you to take the existing Bluefruit LE app and modify it to collect data from any Arduino-compatible sensor.
How This Tutorial Works
For each feature that you add to the app, the subtasks are written out in English (pseudocode), but there are no code snippets in this tutorial. After you try it, let me know if code snippets would have helped you learn–I might add them later. If you find that you’re stuck and need some help, I pasted all the snippets into a file, which is linked at the end of the tutorial.
Prerequisites
Before the crash course, be sure that you have
- Acquired an analog sensor, Arduino Uno, and Bluefruit LE breakout module. You must also have an iOS device running iOS 8 or higher, and a Mac computer running Xcode 6 or higher.
- Connected the analog sensor to your Arduino Uno’s A5 pin and checked the data in the Arduino serial monitor.
- Connected the Bluefruit LE to your Uno and completed the Bluefruit LE tutorial.
- Downloaded the Bluefruit LE app from the App Store and checked that data is being transmitted from your sensor system (sensor+Uno+Bluefruit) and displayed in the Bluefruit LE app.
Getting Started
Download the source code for the Bluefruit LE app here. We will modify this code in three ways:
- Add location and time data to each sensor value, creating a new “SensorRecord” class.
- Write SensorRecords to an array.
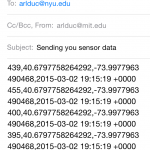
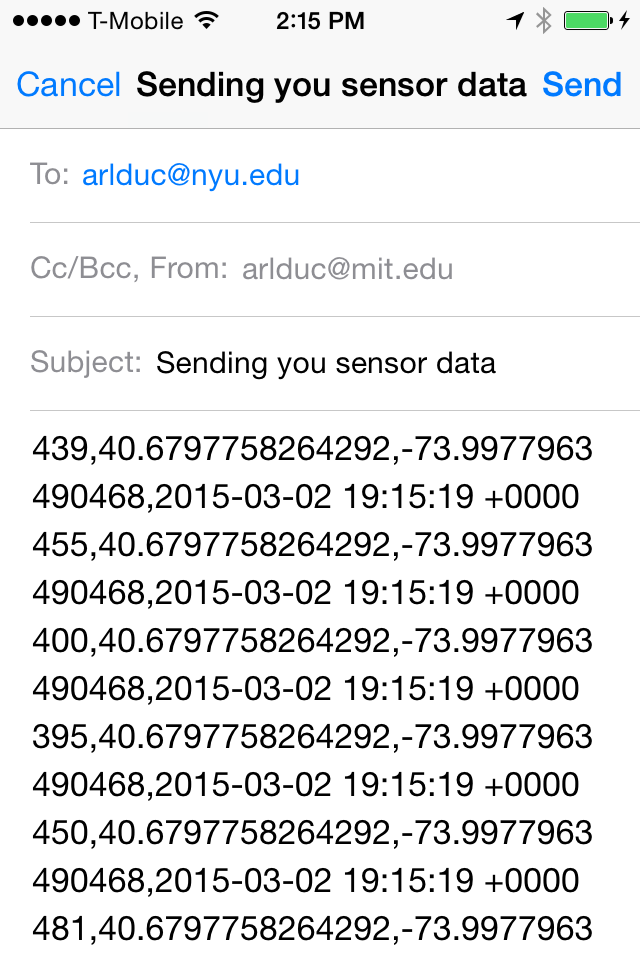
- Give the user the option to email the array of SensorRecords as a list of CSVs (comma-separated values), which can then be imported into spreadsheet, GIS, and other environments for visualization and analysis.
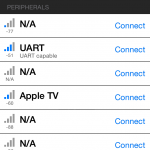
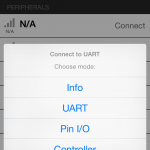
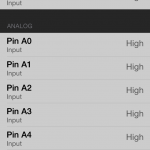
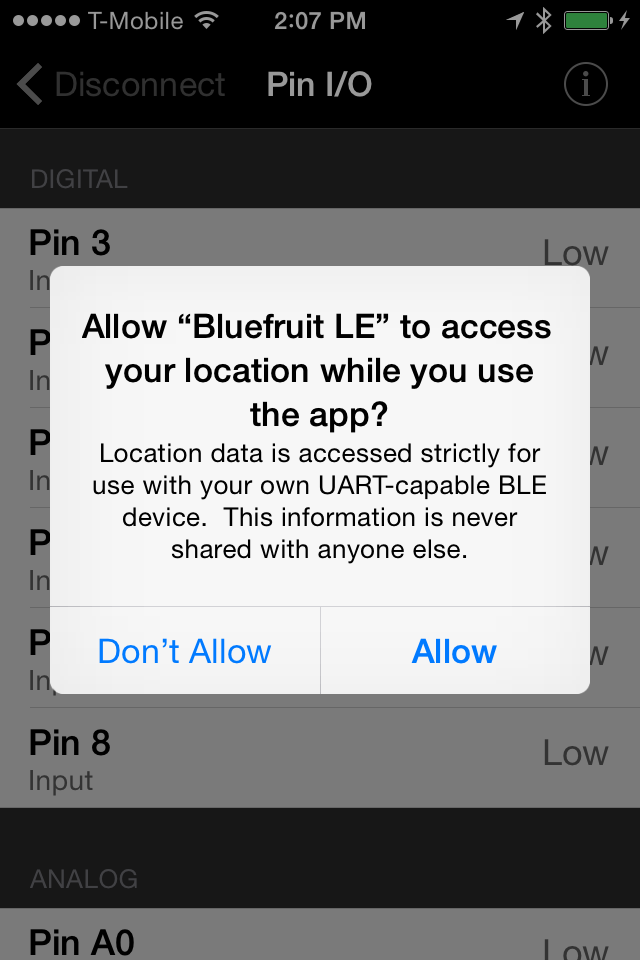
After you complete these modifications, your app should display a succession of new elements like those in the screenshots below. When interacting with the app, you are given the option to email your sensors values when you “Disconnect” from your sensor system.
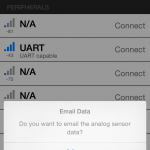
I found the location element to be the most complicated since it involves issues of user privacy and permissions, so we will save that part for last.
Step 1: Getting Acclimated in Swift
If you have never programmed for iOS in Objective-C, take this Apple tutorial to get acclimated to the iOS development environment with Objective-C. Now that Apple has introduced the Swift language to be simpler and less error prone than Objective-C, we’re starting to see more codebases written in Swift, including the Bluefruit LE app.
Swift, which has been called “Objective-C without C,” is meant to employ concepts and syntax closer to more modern languages like javascript or Ruby. It took me a day or so to get used to Swift syntax, and a few more days to understand the concepts of forced unwrapping / optional chaining (the reason you see so many “!” and “?” marks in Swift code), which is why I recommend the particular links below.
Step 2: Writing Sensor Values to an Array
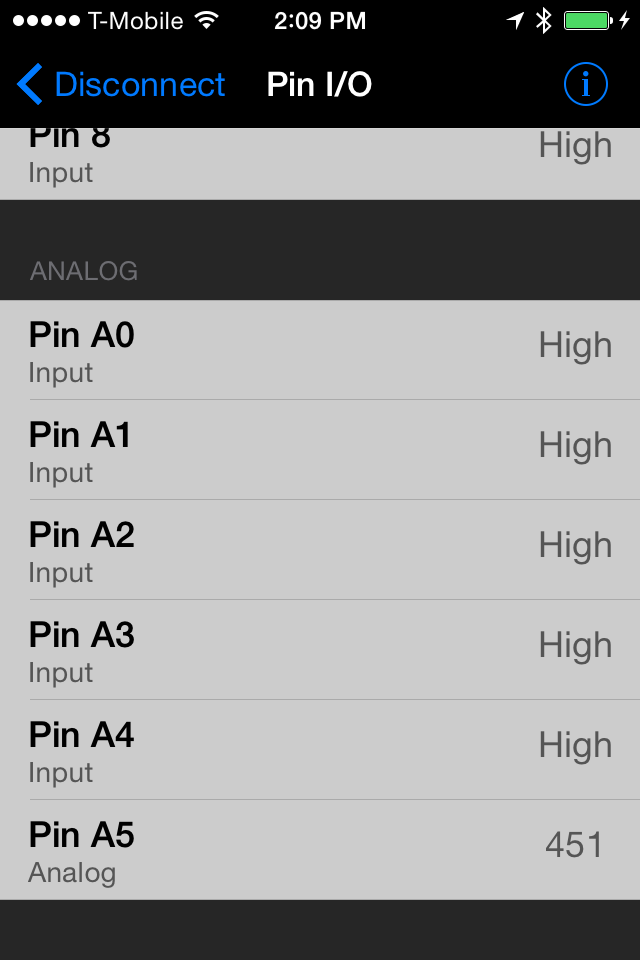
In the original Bluefruit code, the pin I/O values displayed without being stored, so our first coding task is to store those values in an array. The Swift Tutorial: How to use an Array in Swift may be helpful for this task. We will first focus on the existing class PinIOViewController, which manages the numeric display for each I/O pin. In the class’s file PinIOViewController.swift, see if you can complete these subtasks to write the data to an array.
- In the variable declaration section, declare an array of type Int called sensorDataVal
- In the method processInputData, locate the lines where new analog values are processed. Hint: look for the comment “//Analog Reporting (per pin)”
- Write new analog values to sensorDataVal and println them to the output console.
- Try running the app on your device.
You will need to make sensorDataVal available to the main viewcontroller, BLEMainViewController, so the values can be passed into an email. In the class’s file BLEMainViewController.swift, see if you can complete these subtasks to write the data to an array.
- In the variable declaration section, declare a private array of type Int called previousSensorDataVal
- In the method navigationController, locate the else clause that indicates a return from the PinIOViewController. Hint: look for the name ConnectionMode.PinIO
- In this clause, load pinIoViewController’s data into previousSensorDataVal
- Try running the app on your device.
Step 3: Emailing Sensor Values
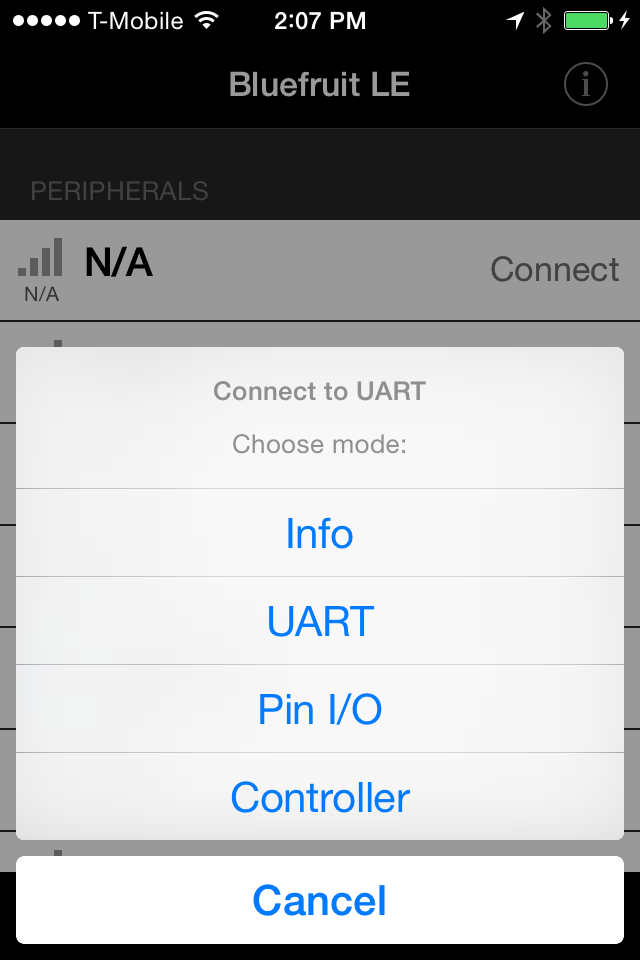
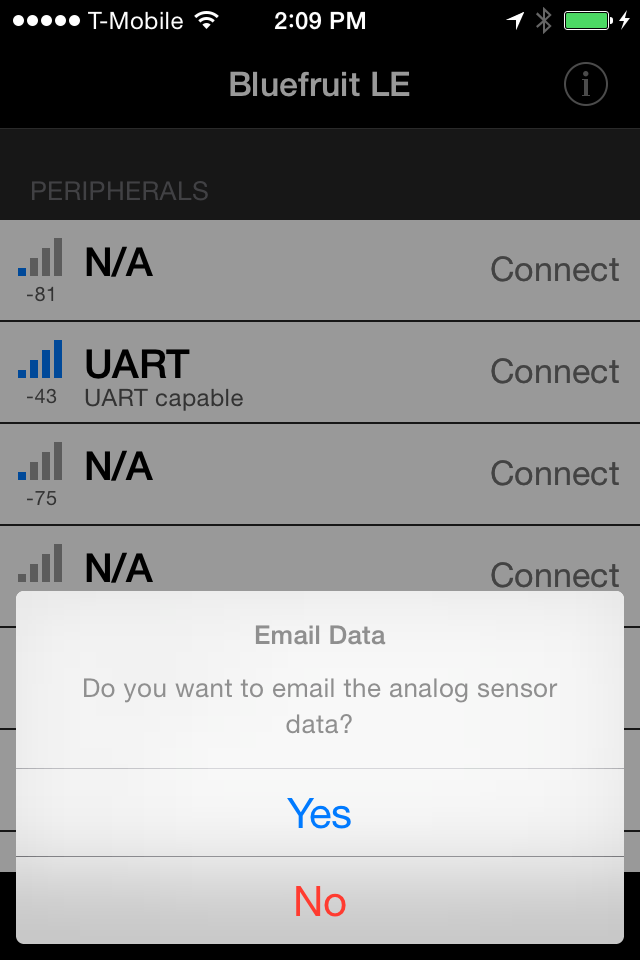
In BLEMainViewController, we will set up an alert to ask the user if she wants to email the sensor data, as well as relevant email functionality. To learn about alerts in iOS, NSHipster’s explanation of UIAlertController may be helpful. To learn about sending in-app e-mails, check out Send Email In-App – Using MFMailComposeViewController with Swift. Now see if you can complete these subtasks in BLEMainViewController.swift:
- In the same else clause that indicates a return from PinIOViewController, add a UIAlertController to ask the user whether to send an email of sensor values. Add a UIAlertAction for if the user answers YES, and a separate UIAlertAction for if the user answers NO.
- Now modify the YES UIAlertAction to send an email. You will need to add 3 additional methods, based on the Send Email In-App link above:
- configuredMailComposeViewController (where you will write the values from previousSensorDataVal out as a String into the email)
- showSendMailErrorAlert
- mailComposeController
- Make BLEMainViewController a subclass of MFMailComposeViewControllerDelegate.
- Try running the app on your device.
Step 4: Adding Location and Time Data to the Mix
If you made it this far, congratulations! You are almost finished. If not, don’t despair, all the code is written out at the end!
Our final step is to add location and timestamp data to each sensor value. This means that we will now record a group of values for each sensor reading, not just one, so it makes sense to convert our sensorDataVal array from an array of Int to an array of a class we create: SensorRecord.
iOS offers a Core Location Framework to query location data based on the device’s built-in GPS, bluetooth, and wi-fi modules. Of this framework, we will include the CLLocation library in our previous Swift files, BLEMainViewController.swift and PinIOViewController.swift, as well as a new Swift file that we create called SensorRecord.swift.
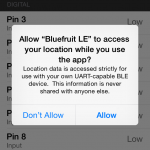
Before you get started in this section, take a look at the Apple Sample Code Locate Me to see how the CLLocation library works. A new, improved privacy feature in iOS 8 is that all apps are programmatically required to request authorization from the user to employ Core Location services. You can read more about it in NSHipster’s post on Core Location in iOS 8. Also take a look at this StackOverflow discussion on Getting a very simple Swift CoreLocation example to work; it helps in culling relevant CoreLocation code into a few lines. After reviewing these resources, try these subtasks:
- Link CoreLocation.framework to your app target (see instructions here)
- Add the line “import CoreLocation” to the head of your BLEMainViewController.swift and PinIOViewController.swift files.
- Create a new SensorRecord.swift file with two variables. Force unwrapping by adding a “!” at the end of each variable declaration:
- an Int called sensorMeasurement
- a CLLocation called locationInfo
- Make PinIOViewController a subclass of CLLocationManagerDelegate
- Add two new variables to PinIOViewController:
- A private CLLocationManager called locManager. This variable will manage GPS connection and user authorization.
- A private CLLocation called currentLocation. Enable forced unwrapping on this variable.
- In PinIOViewController, set up the locManager in the init method. You will need to
- set locManager’s delegate to self
- set locManager’s desiredAccuracy to kCLLocationAccuracyBest
- request permission if device is running iOS8 or higher
- startUpdatingLocations for locManager
- In PinIOViewController, add a new method called locationManager to poll for new GPS data. You can optionally add an error-handling method.
- In PinIOViewController, modify sensorDataVal to be an array of SensorRecords instead of an an array of Ints.
- In BLEMainViewController, modify previousSensorDataVal to be an array of SensorRecords instead of an an array of Ints.
- Try running the app on your device. If it works, you can now deploy the app to email you sensor data!
Step 5: The Working Code
The working code snippets are in this file, but you will still need to figure out where in the pre-existing Bluefruit LE code you should paste these snippets. We will take a look at this file together in class. If you need to use this “cheat sheet” beyond class, use the code’s comments and blocks to help!
Secret Step If You Really Need It
Download the final codebase from Github!

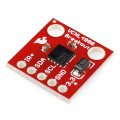 SparkFun Infrared Proximity Breakout – VCNL4000
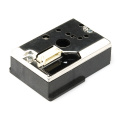 Optical Dust Sensor – GP2Y1010AU0F
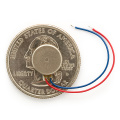 Vibration Motor
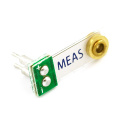 Piezo Vibration Sensor – Small Horizontal
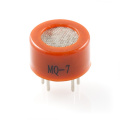 Carbon Monoxide Sensor – MQ-7
 Methane CNG Gas Sensor – MQ-4
 LPG Gas Sensor – MQ-6
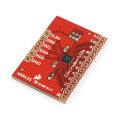 SparkFun Capacitive Touch Sensor Breakout – MPR121
 Load Sensor – 50kg
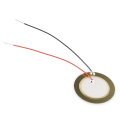 Piezo Element
 Hydrogen Gas Sensor – MQ-8


