Announcements
While you’re waiting for class to begin, please take a look at the links as food for thought.
- Example Vis: Transit Visualization Client, Conversation Concept Map, MIT ML Pantheon
- Example Data Source: Socioeconomic Data and Applications Center (SEDAC), NYC Open Data
- Example application of data visualization: The Next America, The Search for High Energy Cosmic Rays, ProPublica Data
- More visualizations: List of Physical Visualizations, NYSCI Big Data Fest
Agenda
- 6:30-7:00- Syllabus Explanation/Discussion
- 7:00-7:20- Introductions
- 7:20-8:00- Lecture: A Brief History of Data Visualization
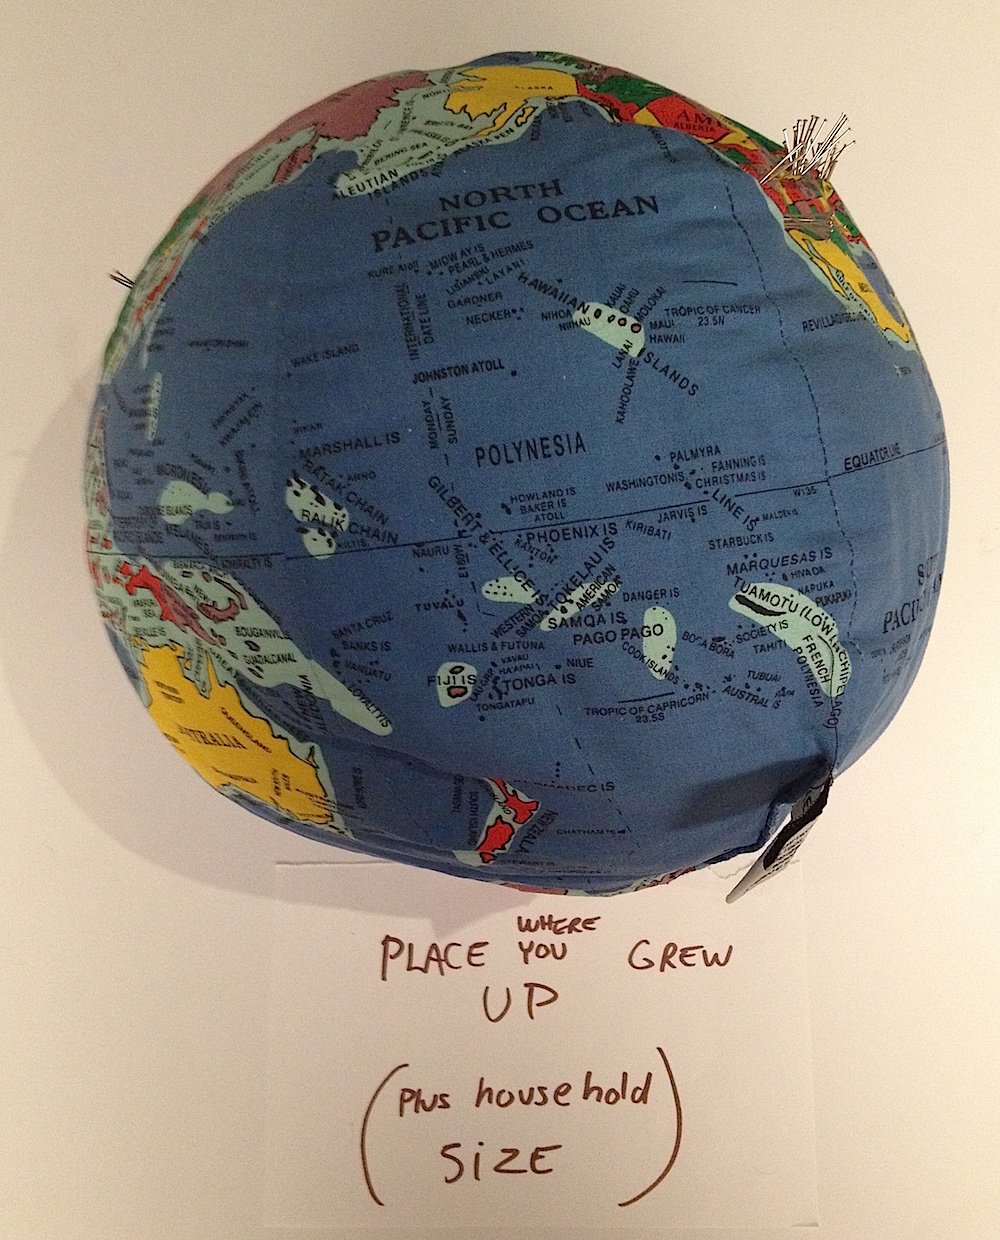
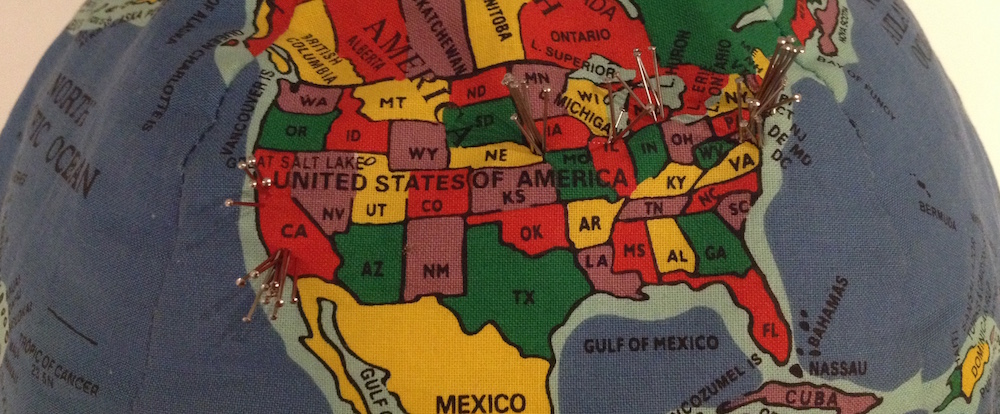
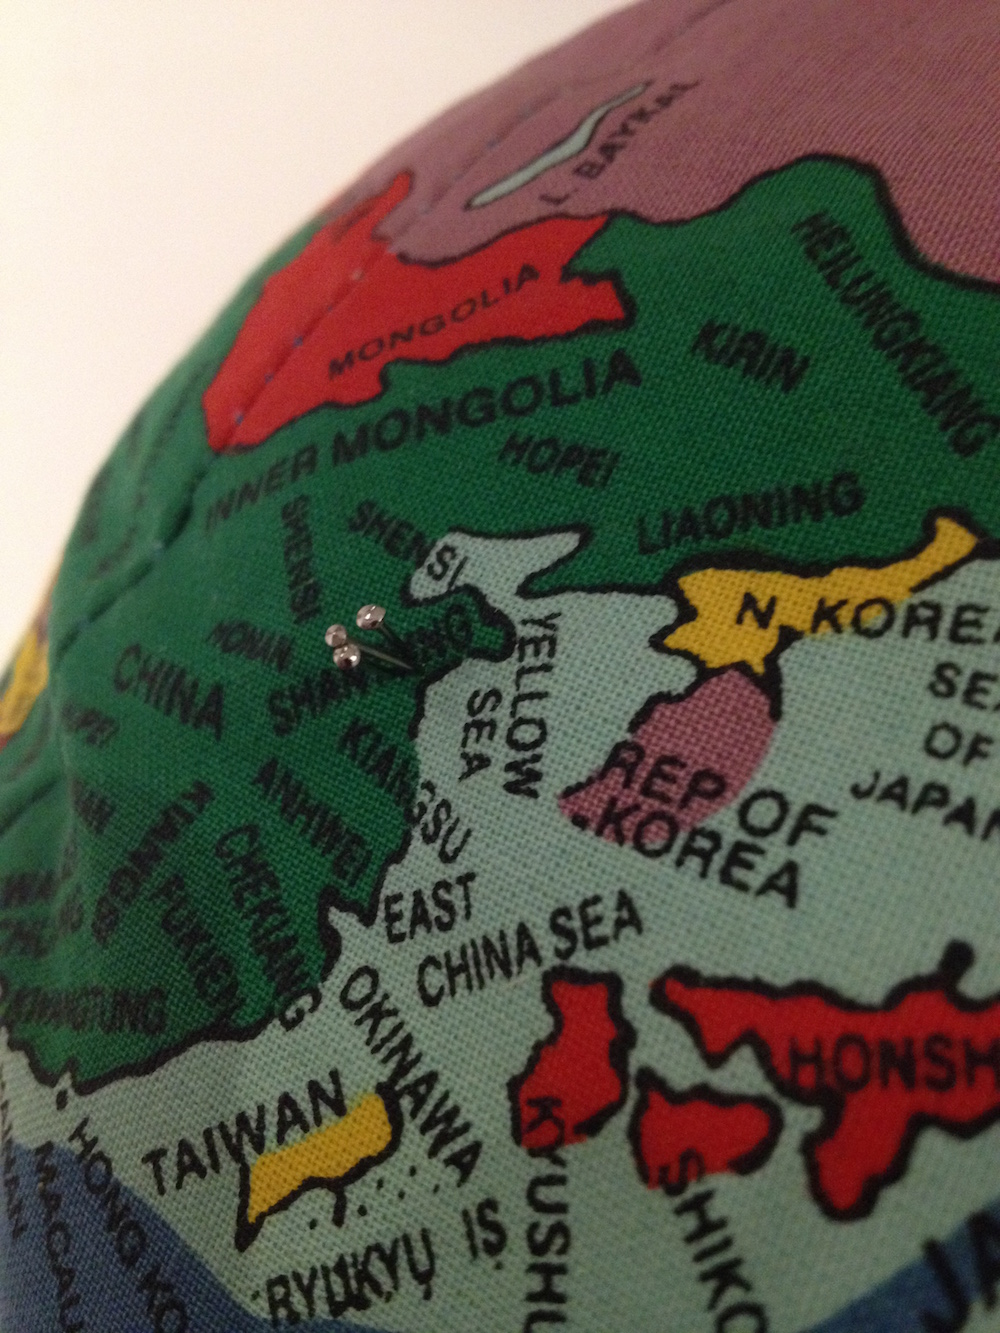
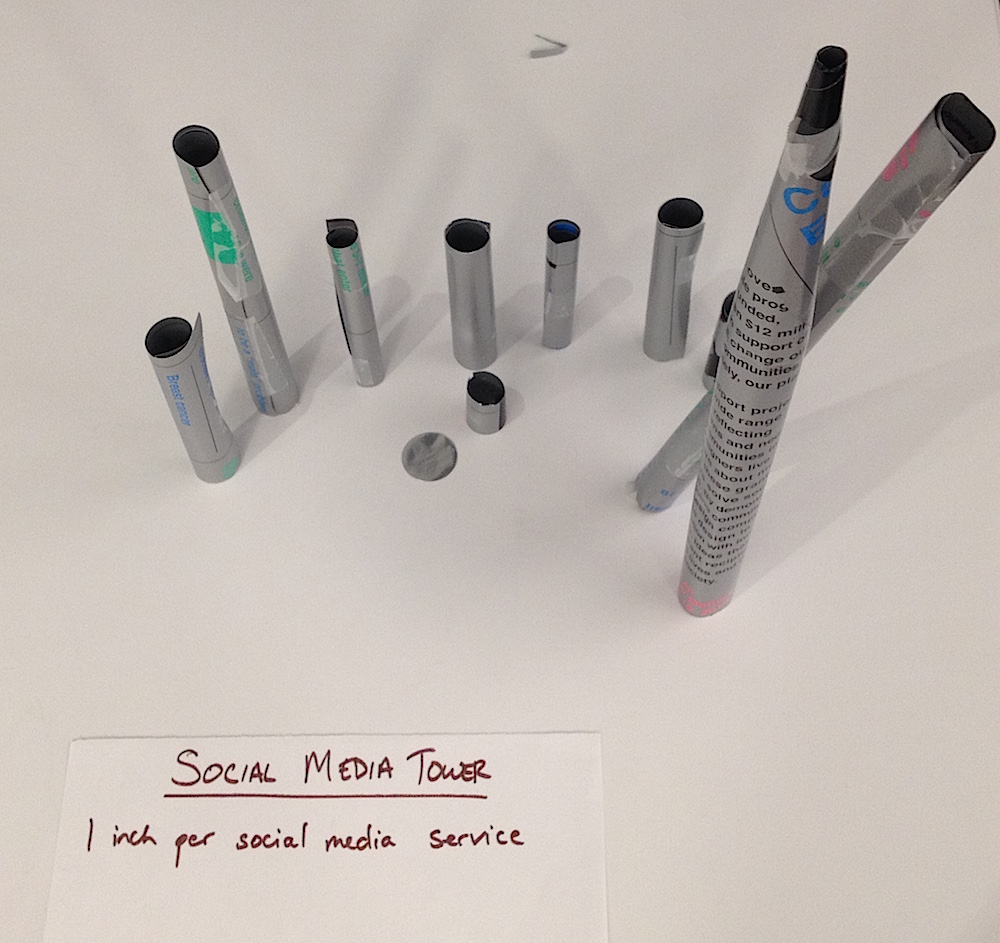
- 8:00-8:40- Break & Data Vis Sculptures
- 8:40-8:55- Reconvene
- 8:55-9:15- Discussion
- 9:15-9:20- Next Week’s Assignments
Next Week’s Assignments
- BOOKS: Go to the library, a bookstore, or an online retailer to get actual, printed book(s) for our DATA VIS BOOK CLUB next week. You can get a recommended book from the syllabus and/or get a book that inspires you. Add your book to this list so we don’t have too many copies of the same book.
- BLOG: If you don’t have a blog already, set one up. Send me the blog URL. Add a brief blog post that
- introduces yourself and why you’d like to take this class.
- includes a link to a data visualization that inspires you. It could be a small visualization that you aspire to make through this class, or a large, long-term team effort. It could be a screen-based visualization or documentation from a tangible visualization (ie a haptic tool or a sculpture). It could be something that you’ve worked on. Briefly describe why it inspires you.
Notes
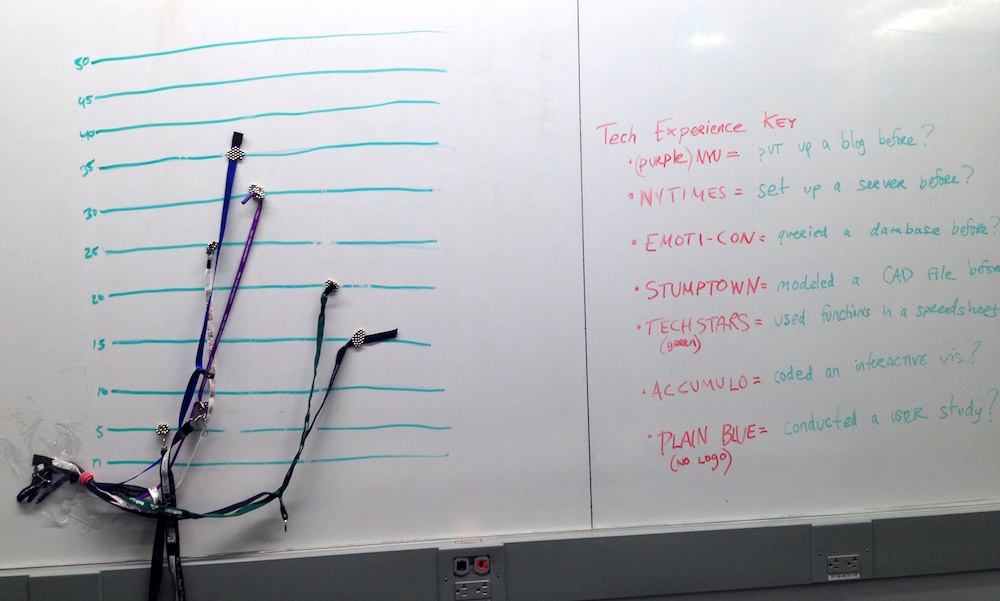
Photos from our Data Vis Sculptures. Captions and more notes to come.