Announcements
- Download QGIS and (from QGIS) QGIS2threejs
- http://www.datasociety.net/
- Obfuscation: A User’s Guide for Privacy and Protest
Agenda
6:30-7:30 Austin Lee, CMU/Microsoft
7:30-8:00 Class updates
8:00-8:10 Break
8:10-9:20 MindRider, QGIS, three.js
Links
3D GIS Examples
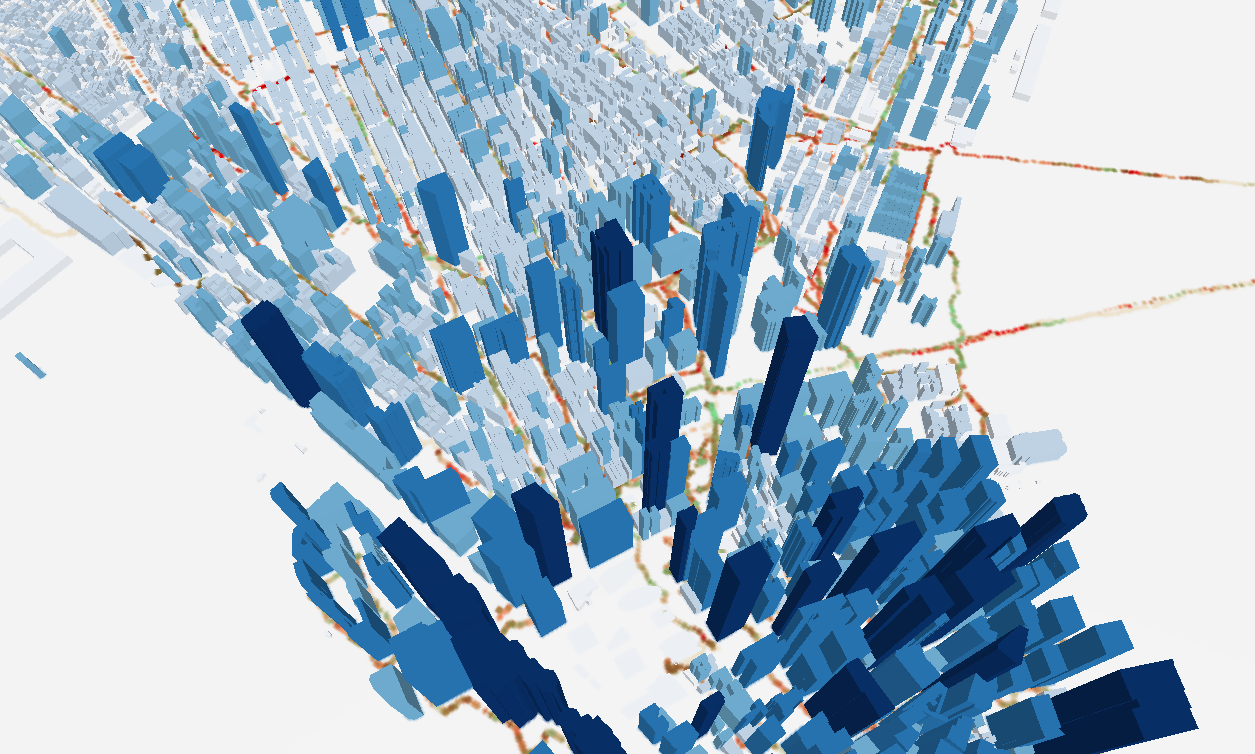
- MindRider 3D data visualizations:
test01 (just downtown)test02 (all of Manhattan)test03 (just downtown, with color-coded buildings)test04 (downtown with attention-meditation data)
test05 (all of Manhattan with attention-meditation data)
mindrider_sampledata (with 10% of the original points) -
3D Vis of Manhattan (includes tutorial comments)
-
3D Vis of Vienna (includes tutorial)
Data and Tutorials
- Tutorial: MindRider in 3D
- Tutorial: MindRider simple QGIS analysis, by Jennifer Sta. Ines (download data here)
QGIS Tips
- QGIS: cropping shapefiles
- QGIS: tutorial for creating polygon layers
- QGIS: importing delimited text files (but don’t process them in Excel!)
- Deleting every Xth line in a text file
Other WebGL libraries
- three.js (book, more examples)
- babylon.js
- philoGL
- 03D
- GLGE
- J3D
Assignment for Next Week
- Finish one of today’s visualization exercises or start your own. Some ideas:
- Visualize the provided MindRider data with 3D buildings.
- VIsualize 3D buildings with another point-based dataset from NYC Open Data.
- Use the QGIS2threejs documentation to visualize a Digital Elevation Model (DEM).
- Use Jennifer Sta. Ines’s tutorial to conduct a simple statistical analysis in QGIS.
- Finals are due in about a month. The requirements will be similar to midterms, with a possible simple analysis component. Start thinking about it!
- Install R in preparation for next week’s class. Download this sample stats file.