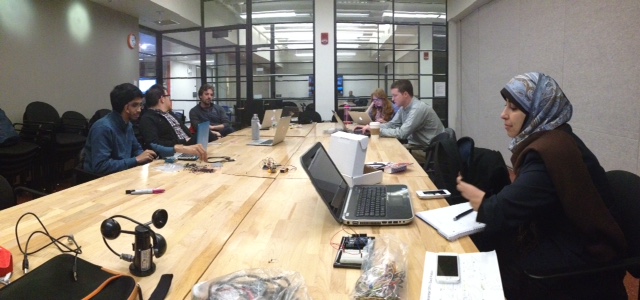
[Above, session participants from left to right: Asresh Guttikonda, Anthony Vanky, Tom Maher, Eleanor Pence, David Newsom, Heba Kurdi]
Today, we’ll finish up with hardware and talk about what we do with the data we collect. We’ll discuss tools for visualization and analysis, and start to ask, how do we take this work further? As practitioners, how do we best leverage all the technologies available to us?
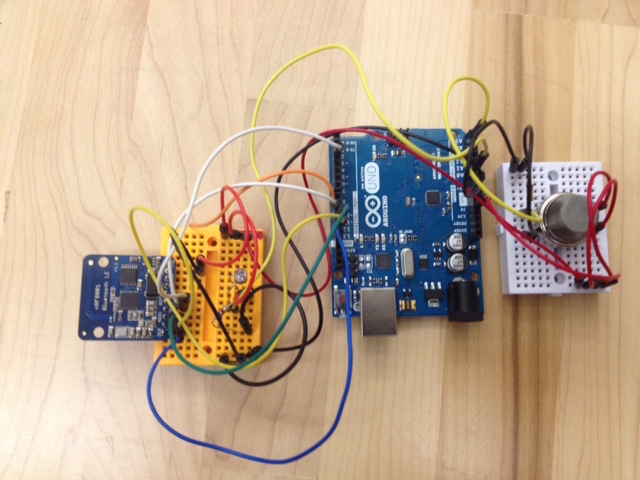
- More hardware stuff:
- Adafruit BLE breakout to the iPhone.
- Further practice (zip file). Set up a GPS/SD logger shield (arduino sketch). Pulse Plus GPS/SD logger
- Optional voltron time.
- Another useful resource: Instructables.com.
- Small batch PCB: https://oshpark.com/, http://www.smallbatchassembly.com/ (best small batch prices as of 2014)
- A bit more iPhone stuff:
- What do we do with the data? Options.
- Write out to CSV via Processing (Tutorial)
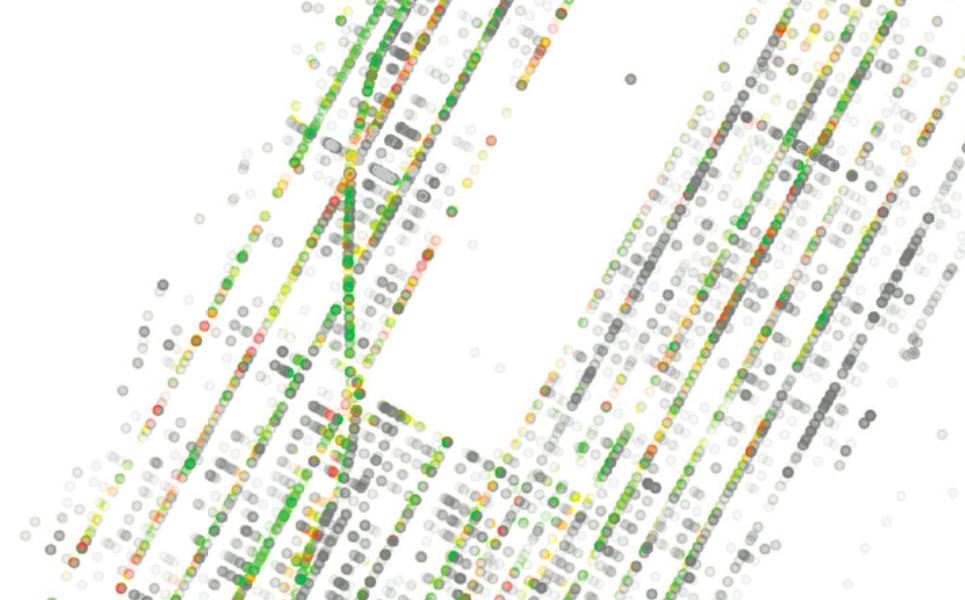
- With a geo-located data set like this MindRider sample, we can visualize it in Tilemill. (Note issue with Yosemite)
- We can also visualize it for web with Leaflet.
- Simple analysis in QGIS. Resource: QGIS Tutorials and Tips.
- Real-time 3D vis: http://www.moviesandbox.net/
- Data Resources
- https://www.temboo.com/
- https://xively.com/
- http://data.sparkfun.com
- http://www.socrata.com/ (hosts NYC Open Data)
- Fabrication Resources
- MIT Hobby Shop
- Danger Awesome (Central Square)
- P.irateship (Sommerville)
- Industry Lab (co-working space with fabrication-oriented companies)
- Back to context. talk: Spatial Considerations. Smart City.
- Please send me 3-5 slides to discuss tomorrow. 15 minutes per person.