What a difference a year makes.
When she presented in my class last year, Jennifer Sta. Ines was a new colleague who presented her work as a GIS specialist for NYC DOT’s bike share program. Now Jennifer is both a friend and collaborator on the MindRider project, so it was great to hear an update on her DOT work, as well as learn some of her techniques for examining data from the MindRider Maps Manhattan pilot study.
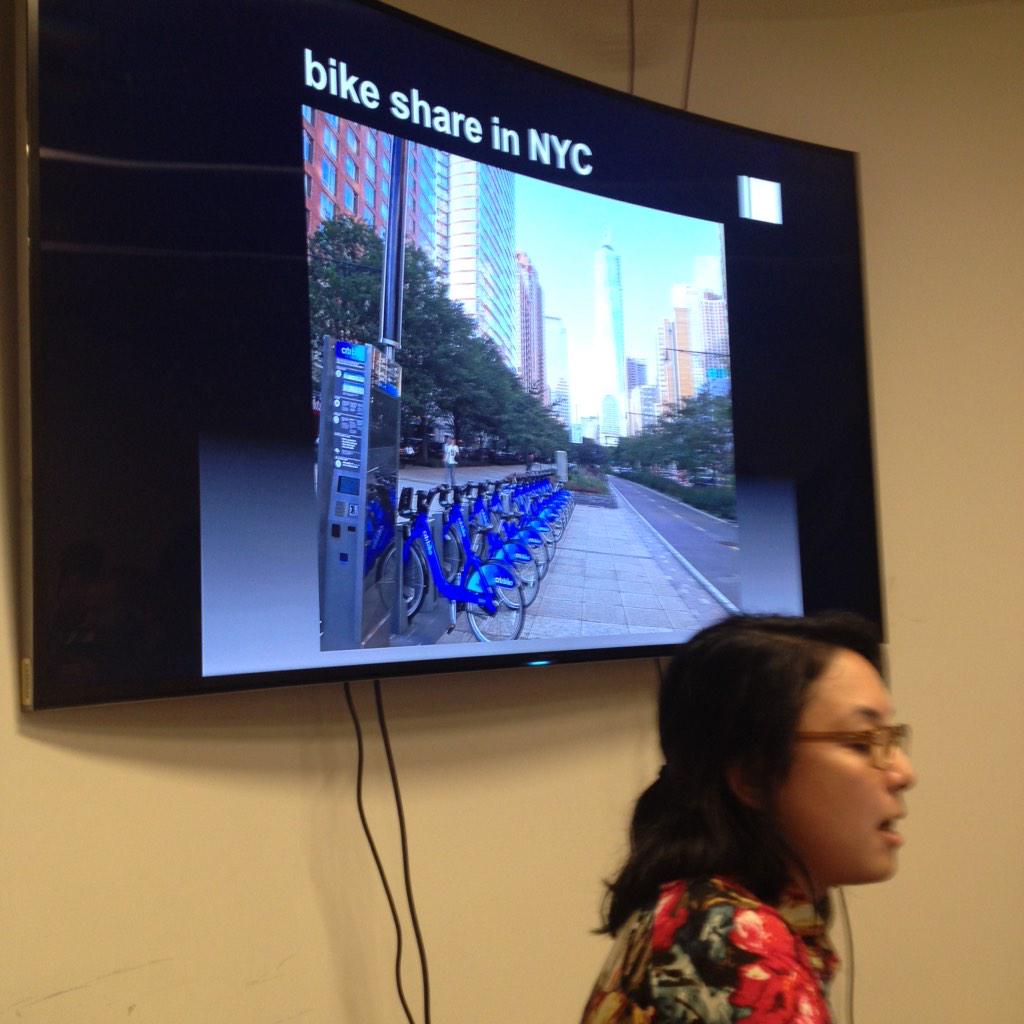
Since Jennifer presented last year, NYC Bikeshare announced a two-year expansion plan to build additional CitiBike stations in Upper Manhattan, Brooklyn, and Queens. To prepare for this expansion, NYC Bikeshare is in the midst of a series of community meetings in the neighborhoods planned for expansion. At these meetings, neighborhood residents have a chance to mark local maps with what they think are the best and worst places for Citibike stations. This discussion of qualitative planning approaches was particularly useful as I look ahead to QSAT’s midterm presentations, in which feedback will be focused on usability. As these community meetings aim to demonstrate, qualitative information can be just as crucial as quantitative data in planning and executing technologies.
Jennifer also spent some time this year talking about the “demand models” used to plan future stations. Demand models, or algorithms used to understand the demand on bikeshare stations across the city, consider a number of factors, including community input, previous station usage, time of usage, type of usage, existing bike routes existing truck routes, subway entrances, places of frequent taxi drop-offs, and major landmarks. The discussion provided a real-world example of how to our in-situ sensor data must often be analyzed in the context of other kinds of data to really help provide insights on city-scale problems.
There were a number of student questions about the demand models, the community meetings, and other relevant topics, after which we proceeded to discuss MindRider briefly and use some of its data in a QGIS lab designed by Jennifer. Coming on the heels of Lela Prashad’s remote sensing discussion and lab, Jennifer’s presentation and lab provided a useful expansion of spatial concepts (from satellites to widely distributed in-situ stations) and skills (from raster-based to vector-based processing). It was also a great exercise for me, being a formerly frequent, but not very rusty, user of QGIS.
As is the case with all of our class labs, the use of the skills learned will vary widely: some of the students will not use QGIS for their analyses, some are already used to deploying ArcGIS (a closed-source geographic information systems package with expanded functionality), and a few found GIS to be a useful, or at least intriguing, new tool for their work.
TODAY’S AGENDA
- Announcements
- Data for Jennifer Sta. Ines’s talk: download here. Video here.
- Blogs: yours and mine.
- Networking event: MIT Senseable City Lab’s Anthony Vanky at METHOD.
- Demo opportunity: Big Data Fest at NYSCI.
- Borrowed parts: please return by March 10 in order to pass!
- More books and parts to borrow.
- Guest Lecture: Transportation planning applications, by Jennifer Sta. Ines, NYC DOT.
- Q&A.
- Hands-on: simple analysis in QGIS
- Break
- Brief discussion of Midterm and Final GOALS.
- Brief intro to iOS, in preparation for this week’s assignments.
- Open lab session.
ASSIGNMENTS FOR NEXT WEEK
[action items are in orange]
- Write a short post or email reflecting on Jennifer Sta. Ines’s guest lecture. What new ideas or questions does today’s session raise for you as you start to prepare for midterm presentations in one month?
- Read through the “Start Developing iOS Apps Today” series on iOS.
- If you are new to iOS, try the first Tutorial:Basics.
- Optional: try Tutorial:Storyboard and Tutorial:Add Data to complete the sample app.
- Skim through “The Swift Programming Language” guide.
- Skim through “Using Swift with Cocoa and Objective-C“
- If you have an iOS device, try running some of the following sample code apps on your device. If you don’t have a device, find a classmate who has one and check out the app.
- Core Motion or another Core Services sample app at the iOS developer library
- Bluefruit_LE_Connect (a Bluefruit LE is required to work properly)